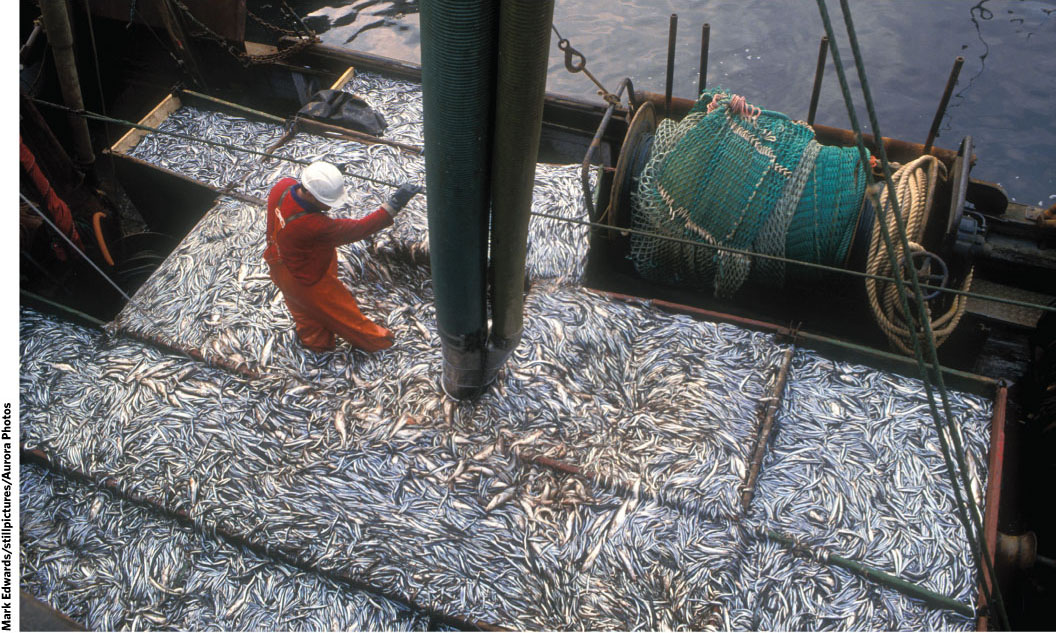
Humans rely on protein from fish, but overfishing is threatening wild fish stocks.
Simply put: Humans need fish. We consume more seafood every year than we do beef, pork, and chicken combined. In fact, more than 15% of the world’s population relies on fish as the main source of protein. In poorer nations, this preference is driven by the cheaper cost of fish compared with meat and poultry. In wealthier nations like the United States, a preference for seafood emerged as scientists uncovered an array of health benefits associated with the omega-3 fatty acids found in fish oils—especially the fish oils of cold saltwater species. In recent decades, a bevy of trendy diets have been built around fish consumption.
KEY CONCEPT 31.2
Modern fishing methods like bottom trawling allow unsustainable fish harvests, damage ocean ecosystems, and kill nontarget species (bycatch).
In 2011, the U.S. Food and Drug Administration doubled the recommended amount of fish in its nutritional guidelines, from one serving to two servings per week. The average American now eats about 15 pounds of fish a year. That’s twice as much as in the 1950s, and the number is likely to increase.
And it’s not just fish protein humans have come to rely on. More than 200 million people around the world earn their living in the fishing industry, which generates some $130 billion annually in global revenue. Developing countries are especially dependent on fish, not only as a source of protein but also as a source of revenue: More than half of all fish sold in the global market comes from developing countries, and fish are the single biggest export from developing countries.
But for all the many health and economic benefits this massive industry provides, it has also exacted huge—some would say catastrophic—environmental costs.
Declining fish populations can impact an ecosystem, especially one with a simple food web comprised of few species, like that of the cold waters of the North Atlantic. Unbalanced food webs could irreversibly change the ocean ecosystem of the Grand Banks cod. Loss of apex predators often disrupts food chains by allowing lower-trophic-level species to increase in number. For example, declines in cod and the fish they feed on have led to an increase in populations of small jellyfish-like organisms called hydroids. Hydroids make it harder for the cod population to recover by feeding on the same food as the very young cod and on the juvenile cod themselves.
KEY CONCEPT 31.3
As supplies of higher-trophic-level fish dwindle, we take fish lower on the food chain, making it hard for the higher-trophic-level fish populations to recover.
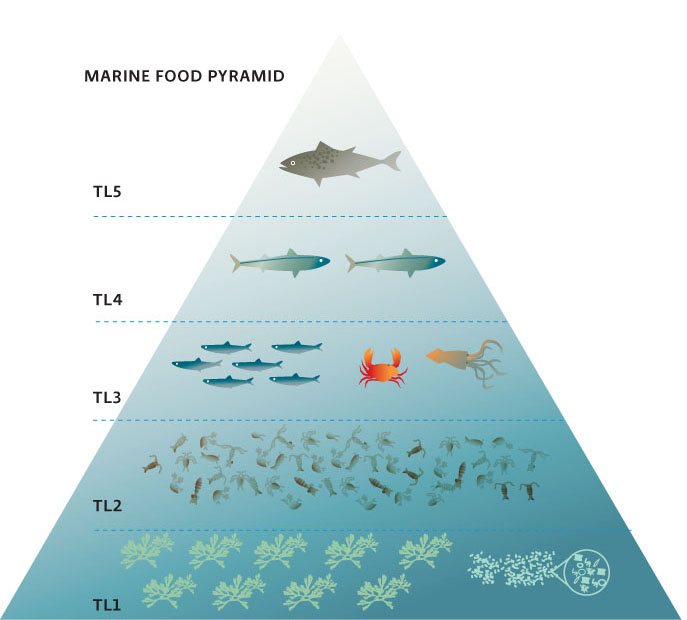
Overfishing of upper-trophic-level fish has led humans to continually seek out new species to harvest, at lower and lower trophic levels; this is called “fishing down the food chain.” Interestingly, fish lower on the food chain are seen as less desirable for human consumption. Some vendors get around this by renaming the fish once it gets to market. For example, there is not much of a market for the invasive Asian carp that is causing problems in North American waters, but marketers here have begun to bring it to market as “silverfin.” INFOGRAPHIC 31.3
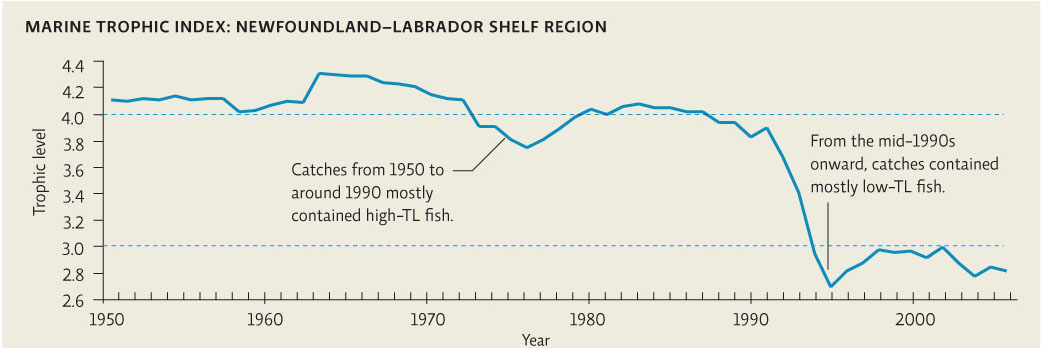
The Marine Trophic Index (MTI) is a measure of the average trophic level (TL) of fish taken in a given year and is an indicator of the status of a marine ecosystem. Higher-TL species like cod and tuna are typically the more sought-after fish. A catch that contains mostly lower-TL fish suggests that higher-TL fish populations are depleted. To determine the MTI, one identifies the trophic level of all fish taken (how many at TL2, TL3, and so on) and then calculates the average TL represented by all fish taken that year.
One of the obstacles to the recovery of cod and other large predatory fish is the loss of their own prey. When cod are depleted, fishers pursue the herring, crabs, and shrimp at lower trophic levels, reducing the food supply for the cod and ultimately jeopardizing cod recovery.

Commercial fishers may switch their targets and start taking fish at lower tropic levels once upper-tropic-level fish populations dwindle. How does this affect the ability of fish populations from upper trophic levels to recover from overfishing?
The upper trophic level fish feed on the fish from lower trophic levels so removing this food source makes it harder for fish at upper trophic levels to recover.
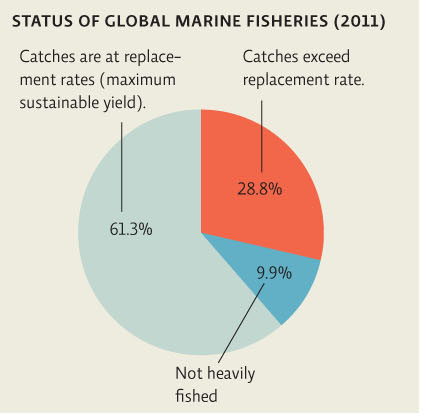
Today, the oceans—not to mention the fish themselves—are in grave danger. The number of large fish like tuna, cod, and halibut in the ocean is only 10% of what it was in 1950. More than half of the world’s fisheries are at their maximum sustainable yield (fully exploited), the amount that can be harvested without decreasing the yield in future years. Roughly 29% are overexploited fisheries, meaning that they are being harvested at an unsustainable level, or depleted fisheries, meaning that the population size is very low compared to historic levels, and there are not enough fish left to support a fishery. Unless we change our ways, scientists predict that all commercially valuable wild fish populations may collapse by the middle of the century. INFOGRAPHIC 31.4
maximum sustainable yield
The amount that can be harvested without decreasing the yield in future years.
overexploited fisheries
More fish are taken than is sustainable in the long run, leading to population declines.
depleted fisheries
The fish population is well below historic levels, and the population’s reproductive capacity is low, meaning that recovery will be slow, if it can occur at all.
KEY CONCEPT 31.4
More than half of world fisheries are fished at or below their maximum sustainable yield, and about a third are currently over exploited.
The percentage of global marine fisheries that is sustainably fished has declined from 90% in 1974 to 61.3% in 2011. The percentage that is overfished (catches exceed replacement rate) has increased almost threefold since the 1970s and is a major concern for fishers and fisheries managers.
Fish catches in the Newfoundland-Labrador Shelf region of the North Atlantic show a distinct shift in the species and amounts taken over the years. Fisheries managers called for a 50% reduction in allowable catch of cod in 1988, but political officials only reduced the amount by 10%. The cod fishery was closed in 1992.
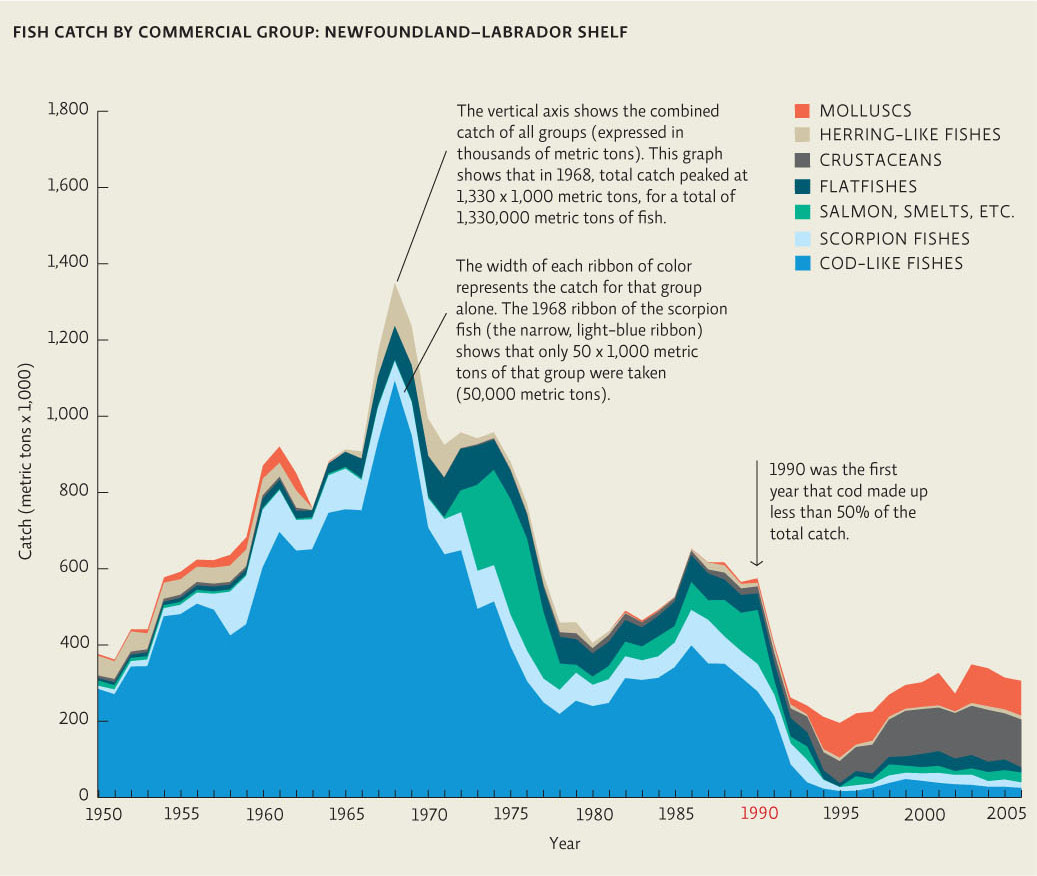
Judging from this area graph, how many metric tons of molluscs were taken in 1950? In 2005?
Molluscs are represented by the orange ribbon in the graph. In 1950, the orange ribbon on the graph is very small (about 2% of the y-axis increment); this would be about 4 x 1,000 or 4,000 metric tons. In 2005, molluscs made up a much bigger percentage of the catch at around 80,000 metric tons (about 40% of the y-axis increment or 80 x 1,000). (To estimate the catch size, measure the width of the correct ribbon at any given year; place that “ribbon width” on the y-axis at the origin to see how far up the y-axis it goes to determine its value in tons x 1,000).