SCIENCE LITERACY WORKING WITH DATA
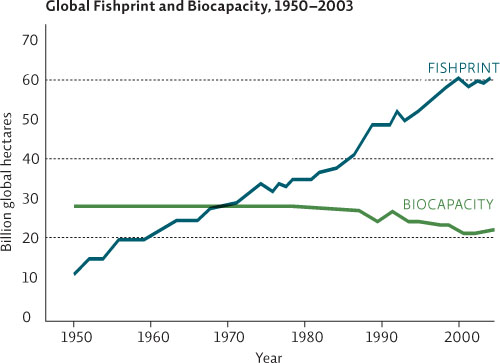
The graph shown here comes from the report The Ecological Fishprint of Nations by Redefining Progress, a public policy think tank that advocates the consideration of environmental issues in economic decisions. The graph displays the global fishprint (a measure of the ocean area needed to produce the fish catch in hectares per metric ton of fish, weighted to reflect the ecological productivity of particular biomes) against global biocapacity (a measure of the ocean’s ability to supply a steady quantity of fish based on the producer productivity in ocean ecosystems and also expressed in terms of area).

Interpretation
1. In one sentence, explain what has happened over time in terms of the human fishprint and the ability of global oceans to support it.
Over time, the human fishprint has increased beyond the biocapacity of oceans to support it.
2. In what year did our fishprint exceed the biocapacity of the ocean?
Around 1973.
3. Ecological overshoot is the difference between the fishprint and biocapacity. What was the ecological overshoot in 1980, in global hectares (gh)? In 1990? In 2003?
Ecological overshoot in 1980: 35 billion gh — 30 billion gh = 5 billion global hectares
Ecological overshoot in 1990: 50 billion gh — 30billion gh = 20 billion global hectares
Ecological overshoot in 2003: 60 billion gh — 25 billion gh = 35 billion global hectares
Advance Your Thinking
Hint: To answer some of the following questions, it might help to access the report at http://rprogress.org/publications/2006/FishprintofNations2006.pdf.
4. Why do you suppose global biocapacity has decreased in recent years?
Overfishing makes it harder to maintain the ocean’s ability to supply a steady quantity of fish year after year. But, in addition, the way our commercial fisheries function make it difficult for fish populations to recover even if the pressure of overfishing is reduced or eliminated. For instance, the concept of “fishing down the food chain” (i.e., moving on to take lower-trophic-level species once the higher levels are depleted) reduces the food supply for the original fish and hampers their recovery. The use of particular fishing methods (such as bottom trawling) destroys ocean ecosystems both due to habitat destruction of areas (such as the seabed) that can often include the spawning grounds for fish, and also because of bycatch (which can threaten many non-target species in the food web). This is a particular problem in certain ecosystems where food webs are simple and their collapse may be irreversibly changing the ocean ecosystem and hence its biocapacity.
5. If RAS facilities like the one described in this chapter are widely adopted, what would likely happen to biocapacity and fishprint in the future? Explain.
If RAS facilities are widely adopted more fish will be produced, but since they will be raised in tanks on land, the global fishprint should decrease (possibly to pre-1970 levels or below) as less ocean area will be needed to produce the fish. At the same time, since ocean food webs will get a respite, assuming that ocean ecosystems can recover, the global biocapacity of the ocean could be restored to pre-1970 levels as well.
6. What would it take to return to global fishprint and biocapacity as they were in the 1950s or 1960s? Describe how the fishprint data can be a useful tool for fisheries managers, aquaculturists, and consumers to help accomplish this reversal.
To return to the metrics of the 1950s or 1960s essentially means that we must reduce the current fishprint and improve the biocapacity of the oceans. To accomplish this we would have to reduce the global fish harvest (by such means as operating at maximum sustainable yields or switching to sustainable aquaculture to reduce pressure on wild fish populations) and restore ocean ecosystems (by such means as changing fishing methods to have less impact on the oceans, establishing MPAs and marine reserves, and reducing pollution entering the oceans).
The fishprint can be helpful in these efforts in a number of ways. For one, it can be used to calculate and establish maximum sustainable yields for various ocean regions taking into consideration the specific biocapacity of that region. This could be particularly helpful for each country within their EEZ and it would provide a consistent sustainability indicator. Secondly, the fishprint could be used to evaluate and improve current aquaculture, as well as develop new projects that are ecologically sustainable within the biocapacity of the marine ecosystems in which they occur. And finally, the fishprint can be used as a means of promoting sustainable consumer choices by allowing consumers to compare the ocean productivity necessary for various fish.