SCIENCE LITERACY WORKING WITH DATA
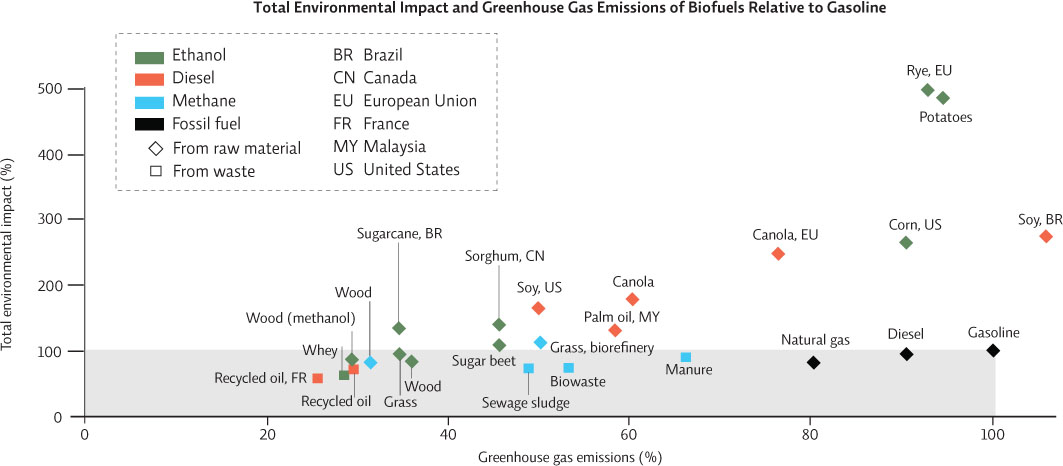
The following graph shows the total environmental impact of biofuels compared to greenhouse gas emissions. Each data point is plotted relative to the emissions and impact of gasoline; fuels that fall in the white area of the graph are considered to be better choices.
Interpretation
1. What does each axis of this graph represent?
x-axis is the percent of greenhouse gas emissions from the various sources; y-axis is the percent of total environmental impact
2. What types of fuel are being compared, and what are their original sources?
Ethanol, diesel, methane, and fossil fuels. The graph reports sources from raw materials and sources from waste products
3. Locate each of the following on the graph: U.S. corn ethanol, Brazilian (BR) sugarcane ethanol, Brazilian soy diesel, Malaysian (MY) palm oil diesel, and gasoline. Note that the first four are the most economically important biofuel sources.
Rank all five in terms of their total environmental impact, from highest to lowest. Which has the highest environmental impact, and which has the lowest? Assuming that all were equally abundant, which would be the most environmentally friendly choice, based on total environmental impact?
Now rank the same fuels in terms of greenhouse gas emissions, from highest to lowest. Assuming that all were equally abundant, which would be the most environmentally friendly choice, based on the need to reduce total greenhouse gas emissions?
a. Highest to lowest environmental impact: Brazilian soy diesel, US corn ethanol, Brazilian sugarcane ethanol, Malaysian palm-oil diesel, and gasoline. Brazilian soy diesel has the highest environmental impact, and gasoline has the lowest. Based only on total environmental impact, gasoline would be the most environmentally friendly choice.
b. Highest to lowest greenhouse gas emissions: Brazilian soy diesel, gasoline, US corn ethanol, Malaysian palm-oil diesel, and Brazilian sugarcane ethanol. Based only on greenhouse gas emissions, Brazilian sugarcane ethanol would be the best choice if the primary goal is the reduction of greenhouse gases.
Advance Your Thinking
4. What kinds of things does the measure “total environmental impact” likely include? (Hint: Look at Infographic 32.3.)
Total environmental impact includes the costs of habitat loss, the use of water to produce biofuels (from the crop through production), loss of food sources to growing fuel, and others listed in Infographic 32.3.
5. Why is the environmental impact for Brazilian soy diesel high?
To grow this crop, rainforest is destroyed, with all the resultant losses in ecosystem services and biodiversity that result.
6. Assuming that the scientists who evaluated these data are correct, what type of fuel contributes the least amount of greenhouse gases AND has the lowest total environmental impact? Why do you think its impact is low relative to other fuel sources?
Biodiesel produced from recycled oil (France) has the lowest greenhouse gas emissions and the lowest overall total impact. This may be due to the relatively efficient process used to convert it to fuel, the fact that the oil does not have to be disposed of as hazardous waste (a cost averted) and the fact that its use, from collection to production to final use, is probably local so transportation costs are minimized.
7. According to the graph, which biofuel would make the most environmental sense to use in the United States, given our current standard of living and the resources we have access to?
Answers may vary. Used restaurant oil is best overall, but it might be argued that supply would be insufficient to meet our current standard of living. Another option could be the combination of waste products (sewage sludge, biowaste, manure). There is an abundant supply of these waste products and they have approximately the same overall environmental impact, and fewer greenhouse gas emissions than gasoline.