SCIENCE LITERACY WORKING WITH DATA
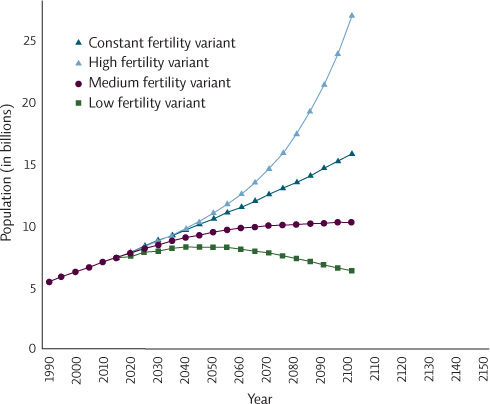
The United Nations Population Division projects future population growth. The four projections in Graph A are each based on a different future fertility rate. The medium fertility variant assumes that the global fertility rate will drop to replacement (2.1), the constant fertility variant assumes no change, and the high and low fertility variants assume that the global fertility rate will be 2.6, and 1.6, respectively.
Interpretation
1. What are the population projections for each fertility variant in 2050? In 2100? What do you predict the population will be in 2150 for the constant fertility variant?
The graph shows the estimated and projected trends of world population growth based on three fertility variants — low, medium, and high. The population projections are as follows:
2050 — constant variant: 10.5 billion; low variant: 8 billion; medium variant: 9.5 billion; high variant: 11 billion
2100 -- constant variant: 15.5 billion; low variant: 6 billion; medium variant: 10 billion; high variant: 25 billion
2150 — constant fertility variant: around 21 billion
2. What is the trend in the numbers in Graph A for each line?
The constant fertility variant continues to increase at the same rate over the time span shown
The high fertility variant continues to increase after 2020 and increases sharply after 2050
The medium variant increases at first but then levels off at about 10 billion by about 2070
The low variant increases up to 2040, plateaus for a few decades and then declines at a steady rate
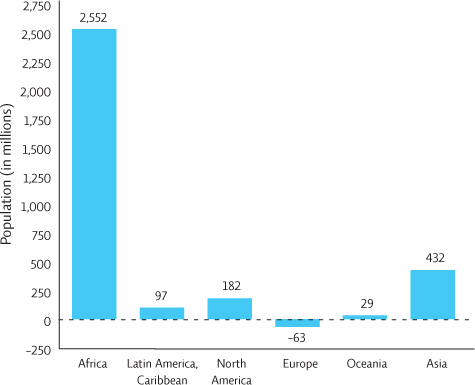
3. How does the information in Graph A relate to that in Graph B? Explain.
Graph A shows the total projected global population growth, which will grow from 6.9 billion in 2010 to 10 billion in 2100 based on the medium fertility variant. Graph B shows how that growth of about 3.1 billion between 2010 and 2100 will be distributed by world regions. At almost 2.6 billion, population growth in Africa will account for most of this growth likely because it has the most in built population momentum.
Advance Your Thinking
4. Explain why the UN might have four population projections based on different fertility rates.
Many cultural, economic, and demographic factors influence population growth by affecting fertility rates — i.e., the number of children a woman has in her lifetime. But these pronatalist factors play out differently in different countries, and often in ways that are not always knowable or predictable. The evidence suggests that fertility rates are dropping across all world regions but they are not falling at the same rate. Thus it is not entirely clear what will happen to fertility 90 years out. It is possible that global fertility rates will level off at replacement (the medium variant) but it is also possible that they might remain slightly higher (the high variant) or fall slightly lower (the low variant).
5. Why is Africa projected to have such large growth if population projections assume that global fertility rates will be at replacement? Use information from the chapter to support your conclusion.
Currently Africa has the most youthful population in the world. This implies an in-built population momentum, in other words the population of Africa will continue to grow for some time (even if fertility rates are at replacement) as more people will be reproducing in the future than now. In addition, many pronatalist factors in Africa still favor higher fertility rates relative to other parts of the world. For example, the desired family size tends to be highest in African countries like Niger and Uganda, infant mortality rates are generally highest in African countries, and the unmet need for contraceptives is highest in Sub-Saharan Africa.