DETAILED CONTENTS
|
INTRODUCTION TO ENVIRONMENTAL, SCIENCE, AND INFORMATION LITERACY |
||
Paul Souders/WorldFoto/Aurora Photos
|
||
|
CHAPTER 1 ENVIRONMENTAL LITERACY AND THE GOAL OF SUSTAINABILITY |
2 |
|
|
ON THE ROAD TO COLLAPSE |
||
|
What lessons can we learn from a vanished Viking society? |
||
|
Environmental science is all encompassing. |
4 |
|
|
INFOGRAPHIC |
||
|
1.1 Environmental Science Is Highly Interdisciplinary |
5 |
|
|
1.2 Different Approaches to Science Have Different Goals and Outcomes |
6 |
|
|
1.3 Wicked Problems |
7 |
|
|
The Greenland Vikings’ demise was caused by natural events and human choices. |
6 |
|
|
Responding to environmental problems and working with neighbors help a society cope with changes. |
8 |
|
|
Humans are an environmental force that impacts Earth’s ecosystems. |
9 |
|
|
INFOGRAPHIC |
||
|
1.4 Many Environmental Problems Can be Traced to Three Underlying Causes |
10 |
|
|
Ecosystems are naturally sustainable and a good model for human societies hoping to become more sustainable. |
11 |
|
|
INFOGRAPHIC |
||
|
1.5 Four Characteristics of a Sustainable Ecosystem |
11 |
|
|
1.6 Sustainable Ecosystems Can be a Useful Model for Human Societies |
12 |
|
|
Humanity faces some challenges in dealing with environmental issues. |
13 |
|
|
INFOGRAPHIC |
||
|
1.7 Social Traps |
14 |
|
|
1.8 Wealth Inequality |
15 |
|
|
1.9 Worldviews and Environmental Ethics |
16 |
|
|
1.10 U.S. Environmental History |
18 |
|
|
CHAPTER 2 SCIENCE LITERACY AND THE PROCESS OF SCIENCE |
22 |
|
|
SCIENCE AND THE SKY |
||
|
Solving the mystery of disappearing ozone |
||
|
Science gives us tools to observe and make sense of the natural world. |
24 |
|
|
INFOGRAPHIC |
||
|
2.1 The Atmosphere and UV Radiation |
27 |
|
|
Scientific views rarely change overnight. |
27 |
|
|
The scientific method systematically rules out explanations. |
28 |
|
|
INFOGRAPHIC |
||
|
2.2 Ozone Depletion and CFC Levels |
28 |
|
|
2.3 Scientific Process |
30 |
|
|
2.4 Certainty in Science |
31 |
|
|
Different types of studies amass a body of evidence. |
30 |
|
|
INFOGRAPHIC |
||
|
2.5 The Chemistry of Ozone Formation and Breakdown |
32 |
|
|
2.6 How Do Scientists Collect Evidence to Answer Questions? |
34 |
|
|
Multiple ozone depletion hypotheses were tested but only the CFC hypothesis was confirmed. |
35 |
|
|
The international community got together to meet the problem head on. |
36 |
|
|
INFOGRAPHIC |
||
|
2.7 The Montreal Protocol and Its Amendments Have Been Effective |
37 |
|

ULTRA.F/Digital Vision/Getty Images
|
||
|
CHAPTER 3 INFORMATION LITERACY AND TOXICOLOGY |
42 |
|
|
TOXIC BOTTLES? |
||
|
On the trail of chemicals in our everyday lives |
||
|
We live in an environment full of toxic substances. |
44 |
|
|
Regulation happens even in the face of change. |
45 |
|
|
Information sources vary in their reliability. |
46 |
|
|
INFOGRAPHIC |
||
|
3.1 Information Sources |
47 |
|
|
What are the dangers presented by toxics, and how do we determine safe exposure levels? |
47 Page VIII
|
|
|
INFOGRAPHIC |
||
|
3.2 Bioaccumulation and Biomagnification |
48 |
|
|
3.3 BPA Studies |
50 |
|
|
3.4 Factors That Affect Toxicity |
52 |
|
|
Endocrine disruptors cause big problems at small doses. |
52 |
|
|
INFOGRAPHIC |
||
|
3.5 How Hormones Work |
53 |
|
|
3.6 Dose-Response Curves |
54 |
|
|
Critical thinking gives us the tools to uncover logical fallacies in arguments or claims. |
55 |
|
|
TABLE |
||
|
3.1 Common Logical Fallacies |
56 |
|
|
Risk assessments help determine safe exposure levels. |
58 |
|
|
HUMANS POPULATIONS AND ENVIRONMENTAL HEALTH |
||

Christian Kober/Robert Harding/Newscom
|
||
|
CHAPTER 4 HUMAN POPULATIONS |
62 |
|
|
ONE-CHILD CHINA GROWS UP |
||
|
A country faces the outcomes of radical population control |
||
|
Human populations grew slowly at first and then at a much faster rate in recent years. |
64 |
|
|
INFOGRAPHIC |
||
|
4.1 Human Population Through History |
64 |
|
|
4.2 Population Distribution |
66 |
|
|
4.3 Age Structure Affects Future Population Growth |
67 |
|
|
Fertility rates are affected by a variety of factors. |
68 |
|
|
INFOGRAPHIC |
||
|
4.4 We Live In Two Demographic Worlds |
69 |
|
|
Factors that decrease the death rate can also decrease overall population growth rates. |
70 |
|
|
INFOGRAPHIC |
||
|
4.5 Demographic Transition |
71 |
|
|
4.6 Declining Population Growth Rates |
72 |
|
|
4.7 Reaching Zero Population Growth |
74 |
|
|
The age and gender composition of a population affects more than just its potential for growth. |
73 |
|
|
Carrying capacity: Is zero population growth enough? |
75 |
|
|
INFOGRAPHIC |
||
|
4.8 How Many People Can Earth Support? |
76 |
|
|
What awaits China’s generation of Little Emperors? |
77 |
|
Vanessa Vick/The New York Times/Redux
|
||
|
CHAPTER 5 ENVIRONMENTAL HEALTH |
80 |
|
|
ERADICATING A PARASITIC NIGHTMARE |
||
|
Human health is intricately linked to the environment |
||
|
Human manipulation of the environment can increase our exposure to pathogens. |
83 |
|
|
INFOGRAPHIC |
||
|
5.1 Types of Environmental Hazards |
85 |
|
|
Public health programs seek to improve community health. |
84 |
|
|
INFOGRAPHIC |
||
|
5.2 Public Health Problems Seek to Improve Health of the Population as a Whole |
86 |
|
|
5.3 Environmental Factors Contribute to the Global Burden of Disease |
87 |
|
|
5.4 A Variety of Pathogens Cause Disease |
88 |
|
|
Addressing biological hazards requires environmental and behavioral changes. |
88 |
|
|
INFOGRAPHIC |
||
|
5.5 Guinea Worm Infection and Eradication Programs |
90 |
|
|
The factors that affect human health differ significantly between more and less developed nations. |
90 |
|
|
Environmentally mediated diseases can be mitigated with funding, support, and education. |
91 |
|
|
INFOGRAPHIC |
||
|
5.6 Death Rates and Leading Causes of Death Differ Among Nations |
92 |
|
|
TABLE |
||
|
5.1 Reducing Environmental Health Hazards |
93 |
|
|
INFOGRAPHIC |
||
|
5.7 Eradicating Guinea Worm Disease |
94 |
|
|
CONSUMPTION AND THE ENVIRONMENTAL FOOTPRINT |
||
|
CHAPTER 6 ECOLOGICAL ECONOMICS AND CONSUMPTION |
98 |
|
|
WALL TO WALL, CRADLE TO CRADLE |
||
|
A leading carpet company takes a chance on going green |
||
|
Businesses and individuals impact the environment with their economic decisions. |
101 Page IX
|
|
|
INFOGRAPHIC |
||
|
6.1 Value of Ecosystem Services |
101 |
|
|
6.2 Ecological Footprint |
103 |
|
|
6.3 Capital and Interest |
104 |
|
|
6.4 The IPAT Equation |
105 |
|
|
Mainstream economics supports some actions that are not sustainable. |
105 |
|
|
INFOGRAPHIC |
||
|
6.5 True Cost Accounting |
107 |
|
|
6.6 Economic Models |
108 |
|
|
6.7 Cradle-to-Cradle Management |
110 |
|
|
Businesses can learn a great deal about how to be sustainable from nature. |
111 |
|
|
INFOGRAPHIC |
||
|
6.8 Product Versus Service Economy |
113 |
|
|
There are many tactics for achieving sustainability |
112 |
|
jacus/iStockphoto/Thinkstock
|
||
|
CHAPTER 7 MANAGING SOLID WASTE |
118 |
|
|
A PLASTIC SURF |
||
|
Are the oceans teeming with trash? |
||
|
Waste is a uniquely human invention, generated by uniquely human activities. |
121 |
|
|
INFOGRAPHIC |
||
|
7.1 U.S. Municipal Solid Waste Stream |
123 |
|
|
How big is the Atlantic Garbage Patch, and is it growing? |
123 |
|
|
How we handle waste determines where it ends up. |
124 |
|
|
INFOGRAPHIC |
||
|
7.2 Municipal Solid Waste Disposal |
125 |
|
|
7.3 How It Works: An Incinerator |
127 |
|
|
Solid waste pollution threatens all living things. |
127 |
|
|
INFOGRAPHIC |
||
|
7.4 Plastic Trash Affects Wildlife |
128 |
|
|
Some waste is hazardous and needs to be handled carefully. |
129 |
|
|
INFOGRAPHIC |
||
|
7.5 Household Hazardous Wastes |
130 |
|
|
When it comes to managing waste, the best solutions mimic nature. |
130 |
|
|
INFOGRAPHIC |
||
|
7.6 Composting |
131 |
|
|
Life-cycle analysis and better design can help reduce waste. |
130 |
|
|
INFOGRAPHIC |
||
|
7.7 Industrial Ecology |
132 |
|
|
Consumers have a role to play, too. |
132 |
|
|
INFOGRAPHIC |
||
|
7.8 The Four Rs Help You Reduce Waste |
134 |
|
|
ECOLOGY |
||
© ClassicStock/CAMERIQUE/Alamy
|
||
|
CHAPTER 8 ECOSYSTEMS AND NUTRIENT CYCLING |
138 |
|
|
ENGINEERING EARTH |
||
|
An ambitious attempt to replicate Earth’s life support systems falls short |
||
|
Organisms and their habitats form complex systems. |
140 |
|
|
INFOGRAPHIC |
||
|
8.1 Organization of Life: From Biosphere to Individual |
142 |
|
|
8.2 Habitat and Niche |
143 |
|
|
8.3 Earth Is a Closed System for Matter but Not for Energy |
143 |
|
|
8.4 Global Terrestrial Biomes |
144 |
|
|
8.5 Map of Biosphere 2 |
147 |
|
|
Living things survive within a specific range of environmental conditions. |
146 |
|
|
INFOGRAPHIC |
||
|
8.6 Range of Tolerance for Life |
148 |
|
|
Nutrients such as carbon cycle through ecosystems. |
149 |
|
|
INFOGRAPHIC |
||
|
8.7 Carbon Cycles via Photosynthesis and Cellular Respiration |
150 |
|
|
8.8 The Carbon Cycle |
151 |
|
|
8.9 The Nitrogen Cycle |
152 |
|
|
8.10 The Phosphorus Cycle |
153 |
|
|
Ecosystems are irreplaceable, but learning how they function will help us restore degraded ones. |
155 |
|
|
CHAPTER 9 POPULATION ECOLOGY |
158 |
|
|
THE WOLF WATCHERS |
||
|
Endangered gray wolves return to the American West |
||
|
Populations fluctuate in size and have varied distributions. |
161 |
|
|
INFOGRAPHIC |
||
|
9.1 Population Distribution Patterns |
163 Page X
|
|
|
Populations display various patterns of growth. |
164 |
|
|
INFOGRAPHIC |
||
|
9.2 Exponential Growth Occurs When There Are No Limits to Growth |
165 |
|
|
9.3 Logistic Population Growth |
166 |
|
|
A variety of factors affect population growth. |
166 |
|
|
INFOGRAPHIC |
||
|
9.4 Density-Dependent and Density-Independent Factors Affect Population Size |
167 |
|
|
9.5 Life History Strategies |
168 |
|
|
9.6 Some Populations Fluctuate in Size Over Time |
169 |
|
|
The loss of the wolf emphasized the importance of an ecosystem’s top predator. |
169 |
|
|
INFOGRAPHIC |
||
|
9.7 Top-Down and Bottom-Up Regulation |
171 |
|
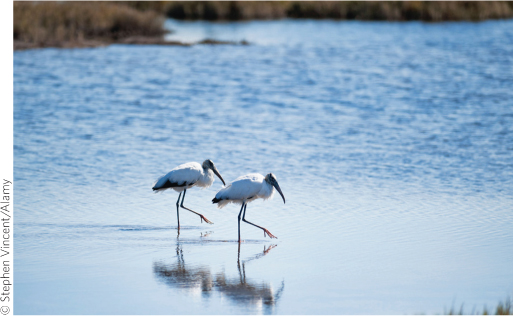
© Stephen Vincent/Alamy
|
||
|
CHAPTER 10 COMMUNITY ECOLOGY |
176 |
|
|
WHAT THE STORK SAYS |
||
|
A bird species in the Everglades reveals the intricacies of a threatened ecosystem |
||
|
The well-being of a species depends on the health of its ecosystem. |
178 |
|
|
Human alterations have changed the face of the Everglades. |
180 |
|
|
Matter and energy move through a community via the food web. |
181 |
|
|
INFOGRAPHIC |
||
|
10.1 Everglades Food Web |
181 |
|
|
10.2 Trophic Pyramid |
183 |
|
|
Communities, such as the ones found in the Everglades, are shaped by biotic and abiotic factors. |
183 |
|
|
INFOGRAPHIC |
||
|
10.3 Species Diversity Includes Richness and Evenness |
185 |
|
|
10.4 Mangrove Edges |
186 |
|
|
10.5 Edge Effects |
187 |
|
|
Changing community structure changes community composition |
186 |
|
|
INFOGRAPHIC |
||
|
10.6 Keystone Species Support Entire Ecosystems |
188 |
|
|
Species interactions are extremely important for community viability. |
189 |
|
|
INFOGRAPHIC |
||
|
10.7 Species Interactions |
190 |
|
|
Ecologists and engineers help repair ecosystems. |
191 |
|
|
INFOGRAPHIC |
||
|
10.8 The Comprehensive Everglades Restoration Plan |
193 |
|
|
Community composition changes over time as the physical features of the ecosystem itself change. |
192 |
|
|
INFOGRAPHIC |
||
|
10.9 Ecological Succession |
194 |
|
|
EVOLUTION AND BIODIVERSITY |
||

James Balog/The Image Bank/Getty Images
|
||
|
CHAPTER 11 EVOLUTION AND EXTINCTION |
198 |
|
|
A TROPICAL MURDER MYSTERY |
||
|
Finding the missing birds of Guam |
||
|
Natural selection is the main mechanism by which populations adapt and evolve. |
201 |
|
|
INFOGRAPHIC |
||
|
11.1 Natural Selection at Work |
203 |
|
|
Populations need genetic diversity to evolve. |
202 |
|
|
INFOGRAPHIC |
||
|
11.2 Evolution in Action |
204 |
|
|
11.3 Coevolution Allows Populations to Adapt to Each Other |
206 |
|
|
11.4 Endangered and Extinct Birds of Guam |
207 |
|
|
Populations can diverge into subpopulations or new species. |
206 |
|
|
INFOGRAPHIC |
||
|
11.5 Random Events Can Alter Populations |
209 |
|
|
The pace of evolution is generally slow but is responsive to selective pressures. |
210 |
|
|
Extinction is normal, but the rate at which it is currently occurring appears to be increasing. |
210 |
|
|
INFOGRAPHIC |
||
|
11.6 Earth’s Mass Extinctions |
211 |
|
|
Humans affect evolution in a number of ways. |
212 |
|
|
INFOGRAPHIC |
||
|
11.7 Humans Use Artificial Selection to Produce Plants or Animals with Desired Traits |
212 |
|
|
TABLE |
||
|
11.1 Common Misconceptions about Evolution |
214 Page XI
|
|
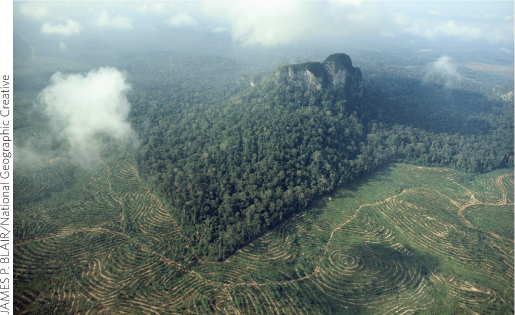
JAMES P. BLAIR/National Geographic Creative
|
||
|
CHAPTER 12 BIODIVERSITY |
218 |
|
|
PALM PLANET |
||
|
Can we have tropical forests and our palm oil too? |
||
|
Biodiversity provides a wide range of essential goods and services. |
220 |
|
|
INFOGRAPHIC |
||
|
12.1 Biodiversity on Earth |
222 |
|
|
12.2 Ecosystem Services |
224 |
|
|
Biodiversity includes variety at the individual, species, and ecosystem levels. |
225 |
|
|
INFOGRAPHIC |
||
|
12.3 Biodiversity Includes Genetic, Species, and Ecosystem Diversity |
226 |
|
|
12.4 Biodiversity Hotspots |
227 |
|
|
Endemism increases with isolation, as does extinction risk. |
228 |
|
|
INFOGRAPHIC |
||
|
12.5 Isolation Can Affect Populations |
229 |
|
|
Biodiversity faces several serious threats. |
228 |
|
|
INFOGRAPHIC |
||
|
12.6 Palm Oil Plantations Are Nothing Like Natural Tropical Forests |
230 |
|
|
12.7 Global Forest Change |
232 |
|
|
Sustainable palm oil may protect biodiversity. |
233 |
|
|
TABLE |
||
|
12.1 Protecting Biodiversity Requires a Consideration of Economic Goals and Environmental Needs |
234 |
|
|
CHAPTER 13 PRESERVING BIODIVERSITY |
238 |
|
|
A FOREST WITHOUT ELEPHANTS Can we save one of Earth’s iconic species? |
||
|
Human impact is the main threat to species worldwide. |
241 |
|
|
INFOGRAPHIC |
||
|
13.1 The Main Threats to Biodiversity Today Come from Humans |
242 |
|
|
13.2 Conservation Designations |
243 |
|
|
Human impact that threatens the forest elephant also puts its entire ecosystem at risk. |
243 |
|
|
There are multiple approaches to species conservation. |
244 |
|
|
INFOGRAPHIC |
||
|
13.3 Single Species Conservation Approach |
245 |
|
|
13.4 Species Conservation: An Ecosystem Approach |
247 |
|
|
13.5 Tracking Poachers by Using Conservation Genetics |
248 |
|
|
Legally mandated protection can aid in species conservation. |
249 |
|
|
TABLE |
||
|
13.1 Legal Protection for Species |
249 |
|
|
INFOGRAPHIC |
||
|
13.6 Global Protected Areas |
250 |
|
|
Conservation plans should consider the needs of local human communities. |
252 |
|
|
TABLE |
||
|
13.2 Many Routes to Conservation |
254 |
|
|
WATER RESOURCES |
||

ConstantinosZ/iStock/360/Getty Images
|
||
|
CHAPTER 14 FRESHWATER RESOURCES |
258 |
|
|
TOILET TO TAP |
||
|
A California county is tapping controversial sources for drinking water |
||
|
Water is one of the most ubiquitous, yet scarce, resources on Earth. |
260 |
|
|
INFOGRAPHIC |
||
|
14.1 Distribution of Water on Earth |
261 |
|
|
14.2 The Water Cycle |
262 |
|
|
14.3 Global Water Use and Access |
263 |
|
|
Like communities around the world, California depends on many sources of water. |
264 |
|
|
INFOGRAPHIC |
||
|
14.4 Groundwater Is Found in Aquifers of Porous Rock or Permeable Soil |
265 |
|
|
Untreated wastewater can contaminate freshwater sources and is a serious health risk worldwide. |
266 |
|
|
Solving water shortages is not easy. |
268 |
|
|
INFOGRAPHIC |
||
|
14.5 How it Works: Wastewater Treatment |
269 |
|
|
Conservation is an important “source” of water. |
272 |
|
|
TABLE |
||
|
14.1 Water-Saving Technologies and Actions |
272 |
|
|
INFOGRAPHIC |
||
|
14.6 Reducing Our Water Footprint |
273 |
|
|
CHAPTER 15 WATER POLLUTION |
278 |
|
|
INTO THE GULF |
||
|
Researchers try to pin down what’s choking the Gulf of Mexico |
||
|
Different types of water pollution degrade water quality. |
280 Page XII
|
|
|
INFOGRAPHIC |
||
|
15.1 Major Causes of Water Pollution |
283 |
|
|
15.2 Eutrophication Can Create Dead Zones |
284 |
|
|
The source of pollution can be hard to pinpoint. |
284 |
|
|
INFOGRAPHIC |
||
|
15.3 Watersheds |
285 |
|
|
Addressing eutrophication begins in the farm field. |
287 |
|
|
INFOGRAPHIC |
||
|
15.4 Addressing the Problem of Fertilizer Runoff |
289 |
|
|
Watershed management is the key to reducing hypoxic zones. |
288 |
|
|
INFOGRAPHIC |
||
|
15.5 Healthy Riparian Areas Provide Many Benefits |
291 |
|
|
15.6 Increasing Infiltration of Stormwater |
292 |
|
|
15.7 Gulf of Mexico Regional Ecosystem Restoration |
293 |
|
|
FOOD RESOURCES |
||

YASUYOSHI CHIBA/AFP/Getty Images
|
||
|
CHAPTER 16 FEEDING THE WORLD |
298 |
|
|
A GENE REVOLUTION |
||
|
Can genetically engineered food help end hunger? |
||
|
World hunger and malnutrition are decreasing but are still unacceptably high. |
300 |
|
|
INFOGRAPHIC |
||
|
16.1 World Hunger |
301 |
|
|
16.2 Malnutrition |
302 |
|
|
Agricultural advances significantly increased food production in the 20th century. |
303 |
|
|
INFOGRAPHIC |
||
|
16.3 The Perks and Problems of Industrial Agriculture and the Green Revolution |
304 |
|
|
The next Green Revolution may be a “gene” revolution. |
305 |
|
|
INFOGRAPHIC |
||
|
16.4 Making a Genetically Modified Organism |
307 |
|
|
TABLE |
||
|
16.1 Examples of GMOs |
309 |
|
|
Concerns about GMOs trigger strong debate. |
309 |
|
|
It will take a combination of strategies to achieve global food security. |
310 |
|
|
INFOGRAPHIC |
||
|
16.5 The Trade-Offs of GMOs |
311 |
|
|
16.6 Low-Tech Farming Methods Can Also Help Address Food Insecurity |
312 |
|
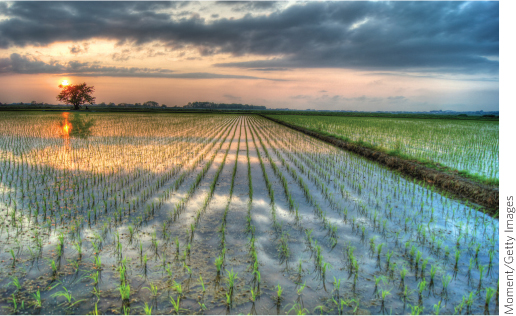
Moment/Getty Images
|
||
|
CHAPTER 17 SUSTAINABLE AGRICULTURE: RAISING CROPS |
316 |
|
|
FARMING LIKE AN ECOSYSTEM |
||
|
Creative solutions to feeding the world |
||
|
INFOGRAPHIC |
||
|
17.1 Sustainable Agriculture |
319 |
|
|
Modern industrial farming has advantages and disadvantages. |
319 |
|
|
INFOGRAPHIC |
||
|
17.2 The Use of Fertilizer Comes with Trade-Offs |
321 |
|
|
17.3 Emergence of Pesticide-Resistant Pests |
322 |
|
|
Mimicking natural ecosystems can make farms more productive and help address some environmental problems. |
324 |
|
|
INFOGRAPHIC |
||
|
17.4 Agroecology: The Duck/Rice Farm |
325 |
|
|
Sustainable techniques can control pests, protect soil, and keep farm productivity high. |
327 |
|
|
INFOGRAPHIC |
||
|
17.5 Integrated Pest Management (IPM) |
329 |
|
|
17.6 Sustainable Soil Management Practices |
331 |
|
|
Consumers also have a role to play in helping to bring about a sustainable food system. |
332 |
|
|
INFOGRAPHIC |
||
|
17.7 Consumer Choices Matter |
333 |
|
|
A sustainable food future will depend on a variety of methods. |
332 |
|
|
TABLE |
||
|
17.1 The Advantages and Disadvantages of Sustainable Agriculture |
335 |
|
|
Can sustainable farming methods feed the world? |
334 Page XIII
|
|
|
CONVENTIONAL ENERGY: FOSSIL FUELS |
||
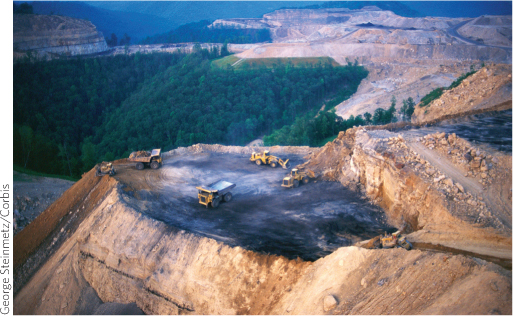
George Steinmetz/Corbis
|
||
|
CHAPTER 18 COAL |
338 |
|
|
BRINGING DOWN THE MOUNTAIN |
||
|
In the rubble, the true costs of coal |
||
|
The world depends on coal for most of its electricity production. |
341 |
|
|
INFOGRAPHIC |
||
|
18.1 How it Works: Electricity Production from Coal |
342 |
|
|
Coal forms over millions of years. |
343 |
|
|
INFOGRAPHIC |
||
|
18.2 Coal Formation |
344 |
|
|
18.3 Major Coal Deposits of the World |
345 |
|
|
Mining comes with a set of serious trade-offs. |
344 |
|
|
INFOGRAPHIC |
||
|
18.4 Mountaintop Removal |
346 |
|
|
18.5 Subsurface Mining |
347 |
|
|
Surface mining brings severe environmental impacts. |
348 |
|
|
Can coal’s emissions be cleaned up? |
351 |
|
|
INFOGRAPHIC |
||
|
18.6 Environmental and Health Problems of Mining and Burning Coal |
352 |
|
|
18.7 How it Works: Carbon Capture and Sequestration (CCS) |
354 |
|
|
Reclaiming a closed mining site helps repair the area but can never re-create the original ecosystem. |
354 |
|
|
INFOGRAPHIC |
||
|
18.8 Mine Site Reclamation |
356 |
|
|
CHAPTER 19 OIL AND NATURAL GAS |
360 |
|
|
THE BAKKEN OIL BOOM |
||
|
Is fracking the path to energy independence? |
||
|
Fossil fuels are a valuable, but nonrenewable, resource. |
362 |
|
|
INFOGRAPHIC |
||
|
19.1 How Oil and Natural Gas Fossil Fuels Form |
363 |
|
|
Oil is a limited resource. |
364 |
|
|
INFOGRAPHIC |
||
|
19.2 Proven Oil and Natural Gas Reserves |
364 |
|
|
19.3 Peak Oil |
365 |
|
|
Conventional oil and natural gas reserves are tapped by drilling wells. |
365 |
|
|
INFOGRAPHIC |
||
|
19.4 How it Works: Conventional Oil and Natural Gas Wells |
366 |
|
|
19.5 Processing Crude Oil |
367 |
|
|
Fossil fuel extraction and use comes at a high environmental cost. |
367 |
|
|
INFOGRAPHIC |
||
|
19.6 Environmental Costs of Oil |
370 |
|
|
Energy producers are turning to unconventional reserves of oil and natural gas. |
369 |
|
|
INFOGRAPHIC |
||
|
19.7 Fracking for Natural Gas or Oil |
371 |
|
|
19.8 Unconventional Oil and Natural Gas Reserves in the United States and Canada |
373 |
|
|
Pursuing unconventional reserves comes with a high environmental cost. |
372 |
|
|
Is fracking the answer to our energy needs? |
374 |
|
|
INFOGRAPHIC |
||
|
19.9 The Trade-Offs of Fracking |
375 |
|
|
Oil consumption drives extraction. |
375 |
|
|
AIR POLLUTION: CONSEQUENCES OF USING FOSSIL FUELS |
||

© 13/ballyscanlon/Ocean/Corbis
|
||
|
CHAPTER 20 AIR POLLUTION |
380 |
|
|
THE YOUNGEST SCIENTISTS |
||
|
Kids on the frontlines of asthma research |
||
|
INFOGRAPHIC |
||
|
20.1 Air Pollution Is a Worldwide Problem |
384 |
|
|
There are many different types of outdoor air pollution. |
384 |
|
|
Air pollution is responsible for myriad health and environmental problems. |
386 |
|
|
INFOGRAPHIC |
||
|
20.2 Outdoor Air Pollution |
386 |
|
|
20.3 The Harvard Six Cities Study Linked Air Pollution to Health Problems |
387 |
|
|
Outdoor air pollution has many sources. |
389 |
|
|
TABLE |
||
|
20.1 Sources and Effects of Air Pollutants |
390 |
|
|
The air we breathe affects our lungs, especially those of children. |
389 |
|
|
Traveling pollution has far-reaching impacts. |
392 Page XIV
|
|
|
INFOGRAPHIC |
||
|
20.4 Acid Deposition |
393 |
|
|
Indoor air pollution is also a significant health threat. |
394 |
|
|
INFOGRAPHIC |
||
|
20.5 Sources of Indoor Air Pollution |
395 |
|
|
We have several options for addressing air pollution. |
394 |
|
|
INFOGRAPHIC |
||
|
20.6 Approaches to Reducing Air Pollution |
398 |
|
|
CHAPTER 21 CLIMATE CHANGE |
402 |
|
|
WHEN THE TREES LEAVE |
||
|
Scientists grapple with a shifting climate |
||
|
Climate is not the same thing as weather. |
404 |
|
|
Evidence of global climate change abounds. |
405 |
|
|
INFOGRAPHIC |
||
|
21.1 A Change in Average Temperature: Why Do Only a Few Degrees Matter? |
406 |
|
|
21.2 Evidence for Climate Change |
408 |
|
|
A variety of factors affect climate. |
407 |
|
|
INFOGRAPHIC |
||
|
21.3 The Greenhouse Effect |
411 |
|
|
21.4 Albedo Changes Can Increase Warming via Positive Feedback |
412 |
|
|
21.5 Climate Forcers |
413 |
|
|
21.6 Milankovich Cycles Help Explain Past Climate Change |
414 |
|
|
21.7 Direct and Indirect Measurements of Temperature and CO2 |
415 |
|
|
Current climate change has both human and natural causes. |
416 |
|
|
INFOGRAPHIC |
||
|
21.8 What’s Causing the Warming? |
417 |
|
|
Some tree species are already migrating north, but it doesn’t mean they will survive. |
417 |
|
|
INFOGRAPHIC |
||
|
21.9 Species’ Responses |
418 |
|
|
Climate change has environmental, economic, and health consequences. |
420 |
|
|
Confronting climate change is challenging. |
421 |
|
|
INFOGRAPHIC |
||
|
21.10 Future Climate Change Depends on Our Current and Future Actions |
422 |
|
|
21.11 Current and Potential Climate Change Impacts and Adaptation Strategies |
424 |
|
|
ALTERNATIVES TO FOSSIL FUELS |
||
AP Photo/David Guttenfelder
|
||
|
CHAPTER 22 NUCLEAR POWER |
428 |
|
|
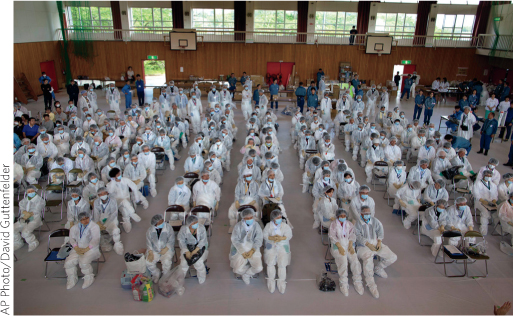
THE FUTURE OF FUKUSHIMA |
||
|
Can nuclear energy overcome its bad rep? |
||
|
The heat of nuclear reactions can be harnessed to produce electricity. |
430 |
|
|
INFOGRAPHIC |
||
|
22.1 Atoms and Isotopes |
432 |
|
|
22.2 Radioactive Decay |
433 |
|
|
22.3 Nuclear Fuel Production |
434 |
|
|
22.4 Nuclear Fission Reaction |
435 |
|
|
Nuclear energy has a troubled history. |
436 |
|
|
Nuclear accidents can be devastating. |
437 |
|
|
INFOGRAPHIC |
||
|
22.5 How it Works: Nuclear Reactors |
438 |
|
|
22.6 Radioactive Isotopes Can Release One or More of Three Different Kinds of Radiation |
439 |
|
|
The generation of nuclear waste is a particularly difficult problem to address. |
440 |
|
|
INFOGRAPHIC |
||
|
22.7 Radioactive Waste |
441 |
|
|
Responding to a nuclear accident is difficult and dangerous work. |
440 |
|
|
The impacts of nuclear accidents can be far reaching. |
443 |
|
|
Will nuclear play a role in future energy? |
444 |
|
|
TABLE |
||
|
22.1 Nuclear Power: Trade-Offs |
446 |
|
|
The future of nuclear energy is uncertain. |
445 |
|
Alessandro Grassani/Invision/Aurora Photos
|
||
|
CHAPTER 23 SUN, WIND, WATER, AND EARTH ENERGY |
450 |
|
|
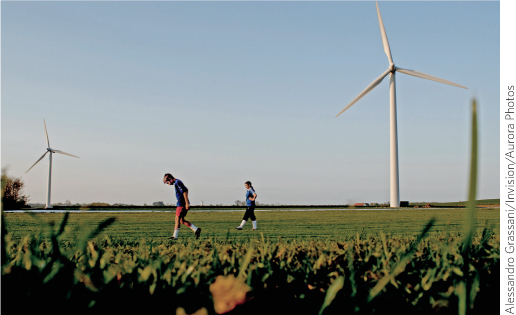
FUELED BY THE SUN |
||
|
A tiny island makes big strides with renewable energy |
||
|
Sustainable ecosystems and societies rely on renewable energy. |
452 |
|
|
To become sustainable, Samsø turned to one of its most plentiful natural resources. |
453 |
|
|
INFOGRAPHIC |
||
|
23.1 Renewable Energy Use |
454 |
|
|
23.2 How it Works: Wind Turbines |
455 Page XV
|
|
|
The most abundant sustainable energy source is the one that powers the planet—the Sun. |
456 |
|
|
INFOGRAPHIC |
||
|
23.3 Solar Energy Technologies Take Many Forms |
457 |
|
|
Energy that causes volcanos to erupt and warms hot springs can also heat our homes. |
458 |
|
|
INFOGRAPHIC |
||
|
23.4 Geothermal Energy Can Be Harnessed in a Variety of Ways |
460 |
|
|
The power of water can be harnessed but comes with Trade-Offs |
459 |
|
|
INFOGRAPHIC |
||
|
23.5 Harnessing the Power of Water |
462 |
|
|
The true cost of various energy technologies can be difficult to estimate. |
461 |
|
|
TABLE |
||
|
23.1 The Trade-Offs of Renewable Energy Sources |
463 |
|
|
Conservation plays a vital role in a sustainable energy society. |
464 |
|
|
TABLE |
||
|
23.2 Saving Energy |
465 |
|
|
INFOGRAPHIC |
||
|
23.6 Energy Efficiency |
466 |
|
|
23.7 Samsø: The Energy-Positive Island |
467 |
|
|
SUSTAINABLE LIVING IN COMMUNITY |
||
TAO Images Limited/Getty Images
|
||
|
CHAPTER 24 ENVIRONMENTAL POLICY |
470 |
|
|
COUNTERFEIT COOLING |
||
|
In the global efforts to thwart climate change, some lessons are learned after the fact |
||
|
Public policies aim to improve life in societies. |
473 |
|
|
INFOGRAPHIC |
||
|
24.1 Addressing Transboundary Environmental Problems Requires International Cooperation |
474 |
|
|
24.2 Policy Decision Making—The NEPA Process |
475 |
|
|
TABLE |
||
|
24.1 Notable U.S. Environmental Laws |
476 |
|
|
Policy making involves many players. |
475 |
|
|
INFOGRAPHIC |
||
|
24.3 Influences on U.S. Environmental Policy Decision Making |
478 |
|
|
A variety of policy tools are being used to address climate change. |
479 |
|
|
INFOGRAPHIC |
||
|
24.4 Policy Tools |
478 |
|
|
24.5 Setting International Policies |
481 |
|
|
24.6 International Efforts to Address Global Climate Issues |
482 |
|
|
Policies sometimes have unintended consequences. |
483 |
|
|
INFOGRAPHIC |
||
|
24.7 Emission Trends |
484 |
|
|
24.8 A Carbon Crediting System Gets Sidetracked |
485 |
|
|
Adapting policies is necessary but difficult. |
486 |
|
Nina Berman/Noor/Redux
|
||
|
CHAPTER 25 URBANIZATION AND SUSTAINABLE COMMUNITIES |
490 |
|
|
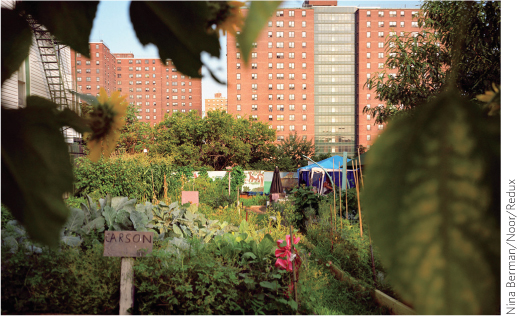
THE GHETTO GOES GREEN |
||
|
Building a better backyard in the Bronx |
||
|
More people live in cities than ever before. |
492 |
|
|
INFOGRAPHIC |
||
|
25.1 Urbanization and the Growth of Megacities |
494 |
|
|
25.2 Many Urban Areas Have Lower Per Capita Ecological Footprints than Average |
496 |
|
|
TABLE |
||
|
25.1 Trade-Offs of Urbanization |
497 |
|
|
Suburban sprawl consumes open space and wastes resources. |
497 |
|
|
INFOGRAPHIC |
||
|
25.3 Urban Flight Contributes to Suburban Sprawl |
499 |
|
|
25.4 Suburban Sprawl |
500 |
|
|
Environmental justice requires engaged citizens. |
502 |
|
|
INFOGRAPHIC |
||
|
25.5 Green Cities |
503 |
|
|
The future depends on making large cities sustainable. |
502 |
|
|
INFOGRAPHIC |
||
|
25.6 Sustainable Cities and Smart Growth |
505 |
|
|
25.7 Green Building |
506 |
|
AVAILABLE ONLINE
ONLINE CHAPTER 26 MINERAL RESOURCES
NO STONE UNTURNED
A bevy of unfamiliar minerals are crucial for our everyday technologies—but they come with a slew of problems
Modern society relies heavily on mineral resources.
INFOGRAPHIC
26.1 Mineral Resources are a Part of Our Everyday Lives
26.2 Earth—A Dynamic Planet
Geologic processes produce mineral resources.
INFOGRAPHIC
26.3 Minerals, Rocks, and the Rock Cycle
Extracting and processing mineral resources impacts the environment.
INFOGRAPHIC
26.4 Mining Techniques
26.5 Extraction of Minerals From Ore Requires Many Processing Steps
26.6 The Environmental Impacts of Mining
Mining also comes with significant social consequences.
INFOGRAPHIC
26.7 The Social Impact of Mining
There are many ways to decrease our use of mineral resources.
INFOGRAPHIC
26.8 Aluminum Recycling: A Success Story
26.9 Alternatives that Reduce Our Use of Mineral Resources
ONLINE CHAPTER 27 SOIL RESOURCES AND GRASSLANDS
RESTORING THE RANGE
The key to recovering the world’s grasslands may be a surprising one
Grasslands provide a wide range of important goods and services.
INFOGRAPHIC
27.1 Grasslands of the World
27.2 Grassland Goods and Services
Grasslands face a variety of human and natural threats.
INFOGRAPHIC
27.3 Desertification
The importance of soil can’t be overemphasized.
INFOGRAPHIC
27.4 Soil Formation
Grasslands can benefit from the grazing style of wildlife but can be degraded by the grazing practices of modern ranching.
INFOGRAPHIC
27.5 Impacts of wild versus domestic grazers
27.6 Undergrazing can increase the proportion of unpalatable species.
Counteracting overgrazing requires careful planning.
Nature offers clues about how to use grasslands sustainably.
INFOGRAPHIC
27.7 Planned Grazing
There are many ways to protect grasslands.
TABLE
27.1 Protecting Grasslands
ONLINE CHAPTER 28 FORESTS
RETURNING TREES TO HAITI
Repairing a forest ecosystem one tree at a time
The type of forest found in an area reflects local climatic conditions.
INFOGRAPHIC
28.1 Forests of the World
28.2 Cross Section of a Forest
Forests provide a range of goods and services and face a number of threats.
INFOGRAPHIC
28.3 Ecosystem Services of Forests
28.4 Threats to Forests
Forests can be managed to protect or enhance their ecological and economic productivity.
INFOGRAPHIC
28.5 Timber-Harvesting Techniques
When it comes to protecting forests, we have many options.
TABLE
28.1 Protecting Forests
ONLINE CHAPTER 29 MARINE ECOSYSTEMSACID OCEANS
ACID OCEANS
Aquanauts explore an ecosystem on the brink
Acidification threatens life in the world’s oceans.
INFOGRAPHIC
29.1 pH and Ocean Acidification
29.2 Acidification Alters Ocean Chemistry and Calcification
Marine ecosystems are diverse.
INFOGRAPHIC
29.3 Ocean Life Zones
29.4 Coral reefs: Distribution and Status
Can some populations adapt to ocean acidification?
Coral reefs are complex communities with lots of interspecific interactions.
INFOGRAPHIC
29.5 Coral Biology
29.6 Coral Bleaching
The world’s oceans face many other threats.
INFOGRAPHIC
29.7 Threats to Oceans
Reducing the threats to oceans requires a multi-pronged approach.
TABLE
29.1 Reducing the Threats to Ocean Ecosystems
ONLINE CHAPTER 30 AGRICULTURE: RAISING LIVESTOCK
A CARNIVORE’S CONUNDRUM
Disease, pollution, and the true costs of meat
The way we raise livestock may jeopardize the safety of food products.
INFOGRAPHIC
30.1 E. Coli—Just the Tip of the Iceberg
Affluence influences diet.
INFOGRAPHIC
30.2 Affluence Affects Diet and Health
CAFOs can raise a large number of animals quickly, but incur a huge environmental cost.
INFOGRAPHIC
30.3 Growing Livestock: Feed and Water Needs
30.4 From Farm to You
A variety of methods can reduce E. coli contamination.
INFOGRAPHIC
30.5 E. Coli 0157:H7 Infections are Decreasing in the United States
There are more sustainable ways to grow livestock.
U.S. food policies support industrial agriculture.
INFOGRAPHIC
30.6 Agricultural Policy Must Consider Trade-Offs
Consumer choices can increase food supply.
INFOGRAPHIC
30.7 Diet and Carrying Capacity
ONLINE CHAPTER 31 FISHERIES AND AQUACULTURE
FISH IN A WAREHOUSE?
How one Baltimore fish scientist could change the way we eat
Industrial fishing is impacting fisheries worldwide.
INFOGRAPHIC
31.1 Meet the Cod
31.2 Bottom Trawling
Humans rely on protein from fish but overfishing of wild stocks makes it harder for fish populations to recover.
INFOGRAPHIC
31.3 Fishing Down the Food Chain
31.4 Status of Marine Fisheries
Laws exist to protect and manage fisheries.
INFOGRAPHIC
31.5 Protection for Marine Areas
Scientists study the possibility of growing marine fish indoors.
Aquaculture presents environmental challenges.
TABLE
31.1 Net Pen and Pond Aquaculture: Problems and Possible Solutions
Indoor fish farming may provide a solution.
INFOGRAPHIC
31.6 Biomimicry in the Pool
ONLINE CHAPTER 32 BIOFUELS
GAS FROM GRASS
Will an ordinary prairie grass become the next biofuel?
Biofuels are a potentially important alternative to fossil fuels.
INFOGRAPHIC
32.1 Biofuel Sources
Biofuels can come from unexpected sources.
INFOGRAPHIC
32.2 Waste to Energy
Turning grass into gas is less environmentally friendly than it sounds.
TABLE
32.1 Biofuel Trade-Offs
Tilman’s experiments showed the importance of biodiversity.
INFOGRAPHIC
32.3 LIHD Crops Offer Advantages Over Traditional Monoculture Biofuel Crops
There is another rising biofuel star: Algae.
INFOGRAPHIC
32.4 Biofuels from Algae
There are many reasons why biofuels have not solved our dependence on fossil fuels.
INFOGRAPHIC
32.5 Bioethanol Production
Multiple solutions will be needed to help replace fossil fuels.
INFOGRAPHIC
32.6 Energy Efficiency and Conservation are Part of the Solution
Despite ongoing controversies and setbacks, the future of biofuels looks bright.