14.8 Analyzing The Science
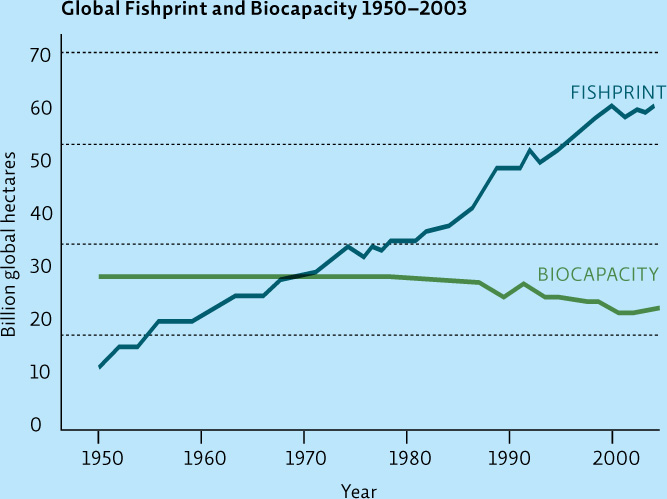
The graph below comes from The Ecological Fishprint of Nations report by Redefining Progress. It tracks the global fishprint (a measure of the ocean area needed to produce the fish catch in hectares per metric ton of fish, weighted to reflect the ecological productivity of particular biomes) against global biocapacity (a measure of the ocean’s ability to supply a steady quantity of fish based on the producer productivity in ocean ecosystems and also expressed in terms of area).
INTERPRETATION
Question 14.11
In one sentence, explain what has happened over time in terms of the human fishprint and the ability of global oceans to support it.
Question 14.12
In what year did our fishprint exceed the biocapacity of the ocean?
Question 14.13
Ecological overshoot is the difference between the fishprint and biocapacity. What was the ecological overshoot in 1980, in global hectares (gh)? In 1990? In 2003?
259
ADVANCE YOUR THINKING
Hint: To answer some of the questions below it might help to access the actual report.
Question 14.14
Why do you suppose global biocapacity has decreased in recent years?
Question 14.15
If RAS facilities like the one described in this chapter are widely adopted, what would likely happen to biocapacity and fishprint in the future? Explain why.
Question 14.16
What would it take to return to a global fishprint and biocapacity as they were in the 1950s or 1960s? Describe three specific strategies using the fishprint as a tool to help accomplish this reversal.