1.9 Analyzing The Science
The following data show the number of different types of livestock grazed in the world and in Nigeria from 1961–2008. Use these graphs and this table to answer the next 5 questions.
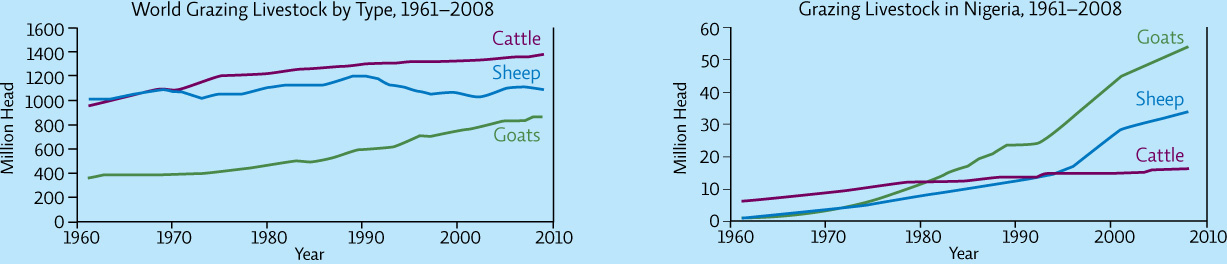
Grazing Livestock Population (in millions)
| Type of livestock | World in 1961 | World in 2008 | % change | Nigeria in 1961 | Nigeria in 2008 | % change |
| Cattle | 942 | 1372 | 6 | 16.3 | ||
| Goats | 349 | 864 | 0.6 | 53.8 | ||
| Sheep | 994 | 1086 | 1 | 33.9 |
19
INTERPRETATION
Question 1.11
How many different livestock types are included in the graphs and what are the trends in the numbers?
Question 1.12
Which animals constituted the bulk of grazing livestock around 2008 on a worldwide basis? In Nigeria? Was this true in 1961 (the first year for which data are reported)? Use the data to explain your responses.
Question 1.13
Using the data from the table, calculate the percent change for each type of animal. According to your calculations which animal changed the most in each case (i.e., worldwide and in Nigeria)?
ADVANCE YOUR THINKING
Question 1.14
Unlike cattle, goats are very flexible in what they can eat, but their sharp hooves also pulverize soil more easily. The data show that the growth in goat populations is particularly dramatic in a developing country like Nigeria. What might explain this pattern? And what might be some potential consequences?
Question 1.15
How might the increase in the size of the goat herd be a potential social trap? What are some ways that we could avoid this trap?