24.10 Analyzing The Science
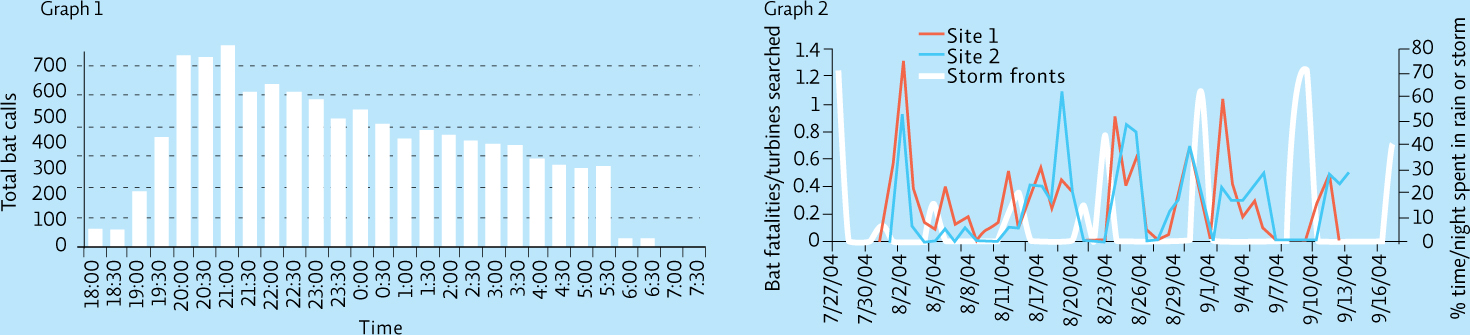
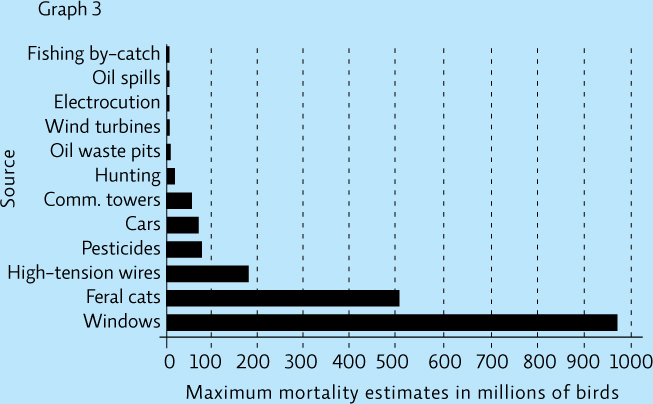
A regional power company has proposed building a wind farm in your community. There is plenty of wind, so many people in the community think this is a good idea. Some, however, have cited the environmental impacts of windmills, especially bird and bat mortality. Examine the following graphs and use them to answer the questions that follow.
INTERPRETATION
Question 24.11
In one or two sentences, summarize the information provided in each graph or table.
Question 24.12
For each graph or table, provide a title and a legend. What is the take-home message for each graph or table?
ADVANCE YOUR THINKING
451
Question 24.13
Based on the data and where you live, what do you think the impact of a wind farm in your area would be on bird and bat mortality? If a wind farm were installed, what recommendations could you make to reduce bat mortality? Make sure to discuss your answer in relation to each of the graphs/tables.
| Date | Buffalo Ridge, MN | Vansycle, OR | Buffalo Mtn., TN | Stateline OR/WA | Foote Creek Rm, WY | Total bat carcasses | % |
|---|---|---|---|---|---|---|---|
| May 1–15 | 0 | 0 | 0 | - | 0 | 0 | 0.0 |
| May 16–31 | 1 | 0 | 0 | - | 1 | 2 | 0.4 |
| June 1–15 | 0 | 0 | 0 | - | 1 | 1 | 0.2 |
| June 16–30 | 3 | 0 | 0 | - | 2 | 5 | 0.9 |
| July 1–15 | 9 | 0 | 9 | 0 | 2 | 13 | 2.8 |
| July 16–31 | 88 | 0 | 0 | 0 | 26 | 110 | 22.2 |
| Aug 1–15 | 127 | 0 | 10 | 0 | 19 | 151 | 28.2 |
| Aug 16–31 | 75 | 4 | 0 | 11 | 33 | 128 | 23.9 |
| Sep 1–15 | 52 | 4 | 8 | 0 | 21 | 81 | 13.1 |
| Sep 16–30 | 4 | 2 | - | 10 | 0 | 20 | 3.7 |
| Oct 1–15 | 1 | 0 | 0 | 8 | 2 | 11 | 2.1 |
| Oct 16–31 | 2 | 0 | 0 | 0 | 0 | 2 | 0.4 |
| Nov 1–15 | 0 | 0 | 0 | 1 | 0 | 1 | 0.2 |