25.11 Analyzing The Science
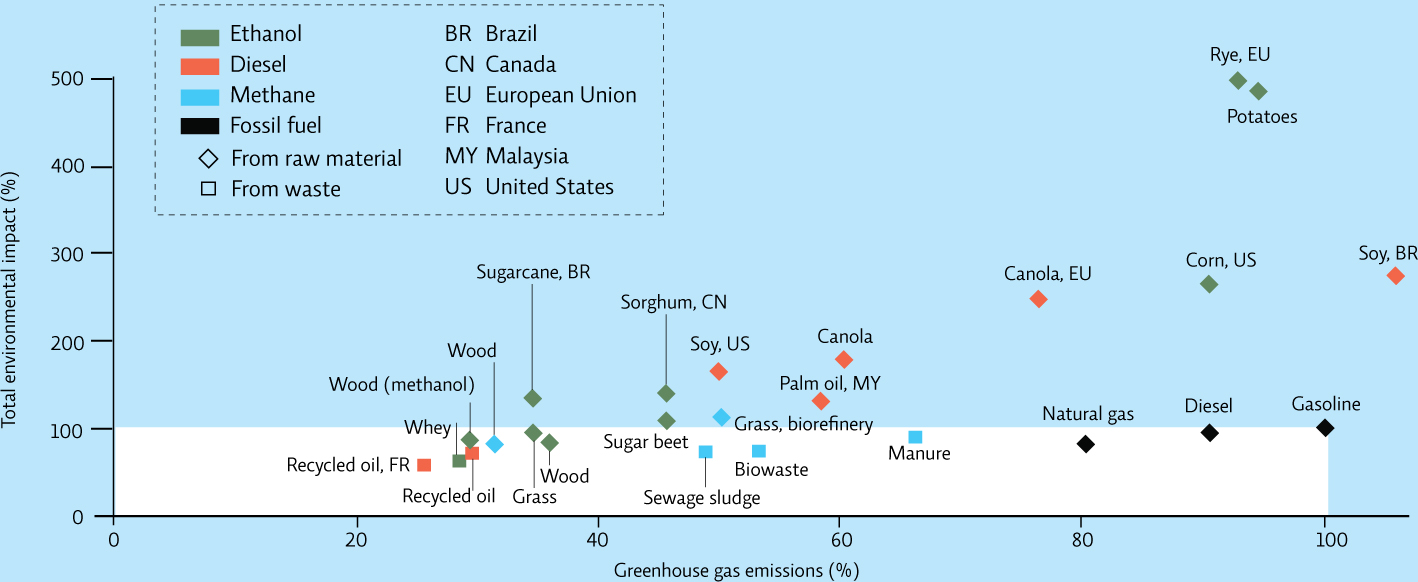
The following graph shows the total environmental impact of biofuels compared to greenhouse gas emissions. Each data point is plotted relative to the emissions and impact of gasoline; fuels that fall in the white area of the graph are considered to be better choices.
471
INTERPRETATION
Question 25.13
What does each axis of this graph represent?
Question 25.14
What types of fuel are being compared, and what are their original sources?
Question 25.15
Locate each of the following on the graph: U.S. corn ethanol, Brazilian (BR) sugarcane ethanol, Brazilian soy diesel, Malaysian (MY) palm oil diesel, and gasoline. Note that the first four are the most economically important biofuel sources.
Rank all five in terms of their total environmental impact, from highest to lowest. Which has the highest environmental impact and which has the lowest? Assuming that all were equally abundant, which would be the most environmentally friendly choice, based on total environmental impact?
ADVANCE YOUR THINKING
Question 25.16
What kinds of things does the measure “total environmental impact” likely include? (Hint: Remember to look at Infographic 25.3.)
Question 25.17
Why is the environmental impact for Brazilian soy diesel high?
Question 25.18
Assuming that the scientists who evaluated these data are correct, what type of fuel contributes the least amount of greenhouse gases and has the lowest total environmental impact? Why do you think its impact is low relative to other fuel sources?
Question 25.19
According to the graph, which biofuel would make the most environmental sense to use in North America, given our current standard of living and the resources we have access to?