3.10 Analyzing The Science
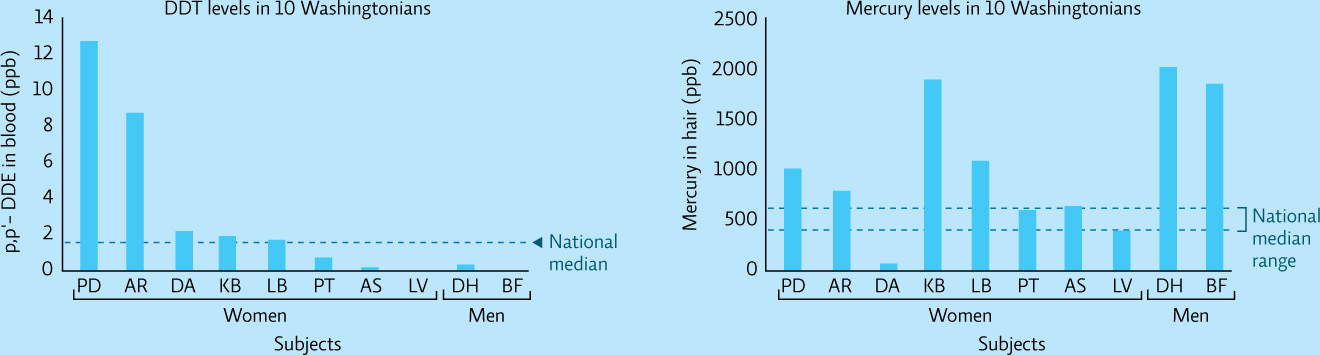
The graphs below come from a 2005 study by the Toxic-Free Legacy Coalition and the Washington Toxics Coalition to identify chemical residues in the human body (http://pollutioninpeople.org/results). Samples of hair, blood, and urine of ten individuals from Washington D.C. were tested for a variety of toxic substances including mercury and DDT. Data for each individual (identified by his or her initials) are shown for p,p′–DDE (a breakdown product of DDT) and for mercury.
INTERPRETATION
Question 3.12
Identify the people with the highest and lowest levels of mercury and DDT.
Question 3.13
Compare the levels of mercury and DDT in each study participant to the national median. Which study participants have levels of DDT and mercury that are at least twice the national median?
Question 3.14
The EPA “safe dose” for mercury is 1100 ppb (parts per billion) for women in their child-bearing years, as mercury levels above this value may impair neurological development in the fetus. Which study participant is above the safe level and by how much?
ADVANCE YOUR THINKING
Question 3.15
Who conducted this study and for what purpose? What type of study do these data represent? Are the data reliable? Explain your responses.
Question 3.16
The pesticide DDT has been banned in Canada and the United States since 1972. How do you explain the presence of DDT in 8 of the 10 study participants?
55