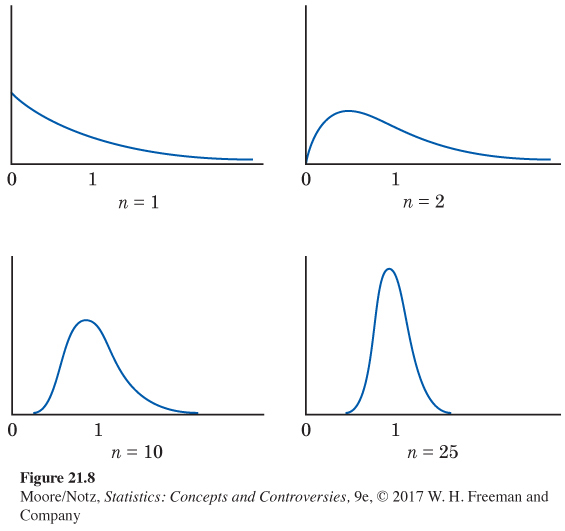
EXAMPLE 6 The central limit theorem in action
Figure 21.8 shows the central limit theorem in action. The top-left density curve describes individual observations from a population. It is strongly right-skewed. Distributions like this describe the time it takes to repair a household appliance, for example. Most repairs are quickly done, but some are lengthy.
The other three density curves in Figure 21.8 show the sampling distributions of the sample means of 2, 10, and 25 observations from this population. As the sample size n increases, the shape becomes more Normal The mean remains fixed and the standard error decreases, following the pattern σ/√n. The distribution for 10 observations is still somewhat skewed to the right but already resembles a Normal curve. The density curve for n = 25 is yet more Normal. The contrast between the shapes of the population distribution and of the distribution of the mean of 10 or 25 observations is striking.
