image
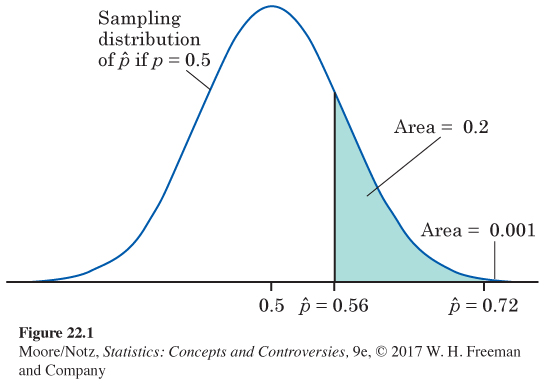
Figure 22.1 The sampling distribution of the proportion of 50 coffee drinkers who prefer fresh-brewed coffee if the truth about all coffee drinkers is that 50% prefer fresh coffee, Example 1. The shaded area is the probability that the sample proportion is 56% or greater.