EXAMPLE 5 Time spent eating
The Bureau of Labor Statistics conducts the American Time Use Survey (ATUS). This survey is intended to provide nationally representative estimates of how, where, and with whom Americans spend their time, and more than 159,000 individuals have been surveyed between 2003 and 2014. In 2014, it was reported that Americans spend an average of 1.23 hours per day eating and drinking. An administrator at a college campus in Ohio conducts a survey of a random sample of 150 college students and finds that the average amount of time these students report eating and drinking per day is ˉx=1.25

Ryuhei Shindo/Getty Images
The hypotheses. The null hypothesis is “no difference’’ from the national mean. The alternative is two-sided because the college administrator did not have a particular direction in mind before examining the data. So, the hypotheses about the unknown mean μ of the population are
The sampling distribution. If the null hypothesis is true, the sample mean ˉx
The data. The sample mean is ˉx=1.25
standard score=observation–
Page 534
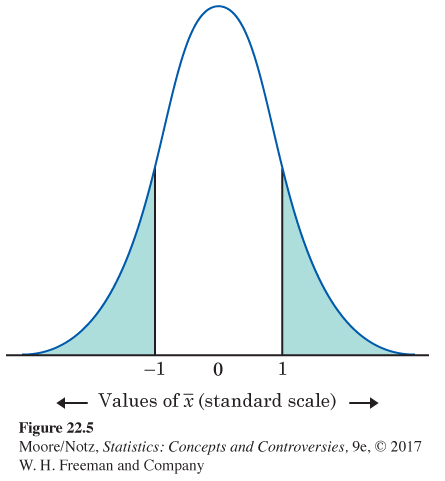
Figure 22.5 The P-value for a two-sided test when the standard score for the sample mean is –1, Example 5.
We know that an outcome 1 standard error away from the mean of a Normal distribution is not very surprising. The last step is to make this formal.
The P-value. Figure 22.5 locates the sample outcome 1 (in the standard scale) on the Normal curve that represents the sampling distribution if H0 is true. The two-sided P-value is the probability of an outcome at least this far out in either direction. This is the shaded area under the curve. Table B says that a standard score of 1.0 is the 84.13 percentile of a Normal distribution. This means the area to the left of 1.0 in the Normal curve is 0.8413. The area to the right is, therefore, 0.1587. The area to the right of 1.0 and to the left of −1.0 is double this, or about 0.3174. This is our approximate P-value.
The conclusion. The large P-value gives us no reason to think that the mean time spent eating and drinking per day among the Ohio college students differs from the national average.