CHAPTER 13 EXERCISES
Question 13.9
13.9 Density curves
(a) Sketch a density curve that is symmetric but has a shape different from that of the Normal curves.
(b) Sketch a density curve that is strongly skewed to the right.
13.9 (a) Answers vary. Rectangular density curve would be an example. (b) Density curve with long tail to the right.
Question 13.10
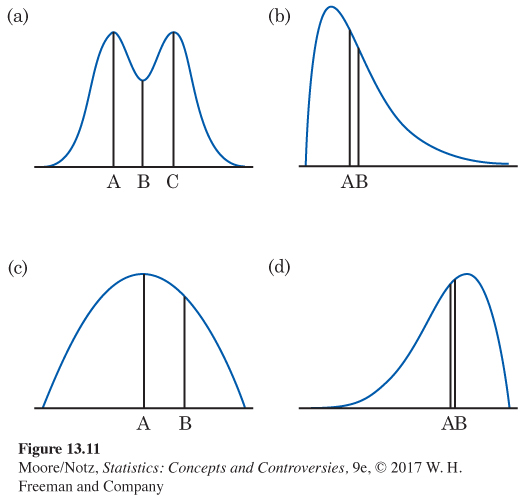
13.10 Mean and median. Figure 13.11 shows density curves of several shapes. Briefly describe the overall shape of each distribution. Two or more points are marked on each curve. The mean and the median are among these points. For each curve, which point is the median and which is the mean?
Question 13.11
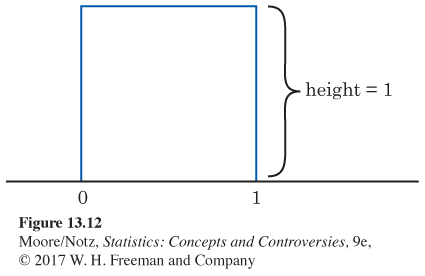
13.11 Random numbers. If you ask a computer to generate “random numbers” between 0 and 1, you will get observations from a uniform distribution. Figure 13.12 shows the density curve for a uniform distribution. This curve takes the constant value 1 between 0 and 1 and is zero outside that range. Use this density curve to answer these questions.
(a) Why is the total area under the curve equal to 1?
(b) The curve is symmetric. What is the value of the mean and median?
(c) What percentage of the observations lie between 0 and 0.1?
(d) What percentage of the observations lie between 0.6 and 0.9?
13.11 (a) The curve forms a 1 × 1 square, which has area 1. (b) Mean and median are both 0.50. (c) 10%. (d) 30%.
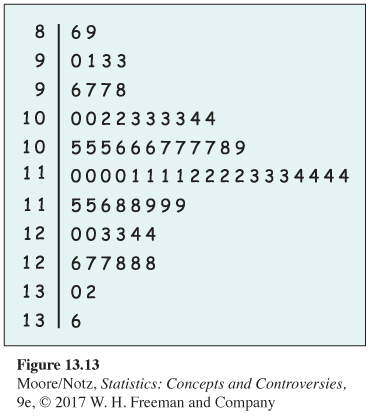
IQ test scores. Figure 13.13 is a stemplot of the IQ test scores of 74 seventh-grade students. This distribution is very close to Normal with mean 111 and standard deviation 11. It includes all the seventh-graders in a rural Midwest school except for four low outliers who were dropped because they may have been ill or otherwise not paying attention to the test. Take the Normal distribution with mean 111 and standard deviation 11 as a description of the IQ test scores of all rural Midwest seventh-grade students. Use this distribution and the 68–95–99.7 rule to answer Exercises 13.12 to 13.14.
Question 13.12
13.12 Between what values do the IQ scores of 68% of all rural Midwest seventh-graders lie?
Question 13.13
13.13 What percentage of IQ scores for rural Midwest seventh-graders are more than 100?
13.13 84%.
Question 13.14
13.14 What percentage of all students have IQ scores below 78? None of the 74 students in our sample school had scores this low. Are you surprised at this? Why?
Question 13.15
13.15 Length of pregnancies. The length of human pregnancies from conception to birth varies according to a distribution that is approximately Normal with mean 266 days and standard deviation 16 days. Use the 68–95–99.7 rule to answer the following questions.
(a) Almost all (99.7%) pregnancies fall in what range of lengths?
(b) How long are the longest 2.5% of all pregnancies?
13.15 (a) 218 to 314 days. (b) Longer than 298 days.
Question 13.16
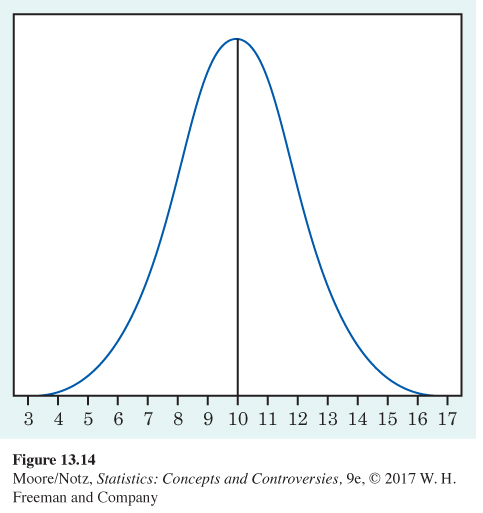
13.16 A Normal curve. What are the mean and standard deviation of the Normal curve in Figure 13.14?
Question 13.17
13.17 Horse pregnancies. Bigger animals tend to carry their young longer before birth. The length of horse pregnancies from conception to birth varies according to a roughly Normal distribution with mean 336 days and standard deviation of three days. Use the 68–95–99.7 rule to answer the following questions.
(a) Between what values do the lengths of the middle 95% of all horse pregnancies fall?
(b) What percentage of horse pregnancies are less than 333 days?
13.17 (a) 330 to 342 days. (b) 16%.
Question 13.18
13.18 Three great hitters. Three landmarks of baseball achievement are Ty Cobb’s batting average of .420 in 1911, Ted Williams’s .406 in 1941, and George Brett’s .390 in 1980. These batting averages cannot be compared directly because the distribution of major league batting averages has changed over the years. The distributions are quite symmetric and (except for outliers such as Cobb, Williams, and Brett) reasonably Normal. While the mean batting average has been held roughly constant by rule changes and the balance between hitting and pitching, the standard deviation has dropped over time. Here are the facts:
| Decade | Mean | Std. dev. |
|---|---|---|
| 1910s | .266 | .0371 |
| 1940s | .267 | .0326 |
| 1970s | .261 | .0317 |
Compute the standard scores for the batting averages of Cobb, Williams, and Brett to compare how far each stood above his peers.
Question 13.19
13.19 Comparing IQ scores. The Wechsler Adult Intelligence Scale (WAIS) is an IQ test. Scores on the WAIS for the 20–34 age group are approximately Normally distributed with mean 110 and standard deviation 15. Scores for the 60–64 age group are approximately Normally distributed with mean 90 and standard deviation 15. Sarah, who is 30, scores 130 on the WAIS. Her mother, who is 60, takes the test and scores 110.
(a) Express both scores as standard scores that show where each woman stands within her own age group.
(b) Who scored higher relative to her age group, Sarah or her mother? Who has the higher absolute level of the variable measured by the test?
13.19 (a) The standard score for both Sarah and her mother is 1.3. (b) Sarah and her mother scored the same relative to each woman’s age group because they have the same standard score. However, Sarah had the higher raw score, so she does have the higher absolute level of the variable measured by the test.
Question 13.20
13.20 Men’s heights. The distribution of heights of young men is approximately Normal with mean 70 inches and standard deviation 2.5 inches. Sketch a Normal curve on which this mean and standard deviation are correctly located. (Hint: Draw the curve first, locate the points where the curvature changes, and then mark the horizontal axis.)
Question 13.21
13.21 More on men’s heights. The distribution of heights of young men is approximately Normal with mean 70 inches and standard deviation 2.5 inches. Use the 68–95–99.7 rule to answer the following questions.
(a) What percentage of men are taller than 77.5 inches?
(b) Between what heights do the middle 68% of men fall?
(c) What percentage of men are shorter than 65 inches?
13.21 (a) 0.15%. (b) 67.5 to 72.5 inches. (c) 2.5%.
Question 13.22
13.22 Heights of men and women. The heights of young women are approximately Normal with mean 65 inches and standard deviation 2.5 inches. The heights of men in the same age group have mean 70 inches and standard deviation 2.5 inches. What percentage of women are taller than a man of average (mean) height?
Question 13.23
13.23 Heights of young adults. The mean height of men aged 18–24 is about 70 inches. Women that age have a mean height of about 65 inches. Do you think that the distribution of heights for all Americans aged 18–24 is approximately Normal? Explain your answer.
13.23 No. It has two peaks because of the two distinct subgroups (men and women).
Question 13.24
13.24 Sleep. The distribution of hours of sleep per week night, among college students, is found to be Normally distributed, with a mean of seven hours and a standard deviation of one hour. Use this information and the 68–95–99.7 rule to answer the following questions.
(a) What percentage of college students sleep more than seven hours? More than eight hours?
(b) What range contains the middle 95% of hours slept per week night by college students?
Question 13.25
13.25 Cholesterol. Low density lipoprotein, or LDL, is the main source of cholesterol buildup and blockage in the arteries. This is why LDL is known as “bad cholesterol.” LDL is measured in milligrams per deciliter of blood, or mg/dL. In a population of adults at risk for cardiovascular problems, the distribution of LDL levels is Normal, with a mean of 123 mg/dL and a standard deviation of 41 mg/dL. If an individual’s LDL is at least one standard deviation or more above the mean, he or she will be monitored carefully by a doctor. What percentage of individuals from this population will have LDL levels one or more standard deviations above the mean?
The following optional exercises require use of Table B of Normal distribution percentiles.
13.25 16%.
Question 13.26
13.26 NCAA rules for athletes. The National Collegiate Athletic Association (NCAA) requires Division II athletes to get a combined score of at least 820 on the Mathematics and Critical Reading sections of the SAT exam in order to compete in their first college year. In 2014, the combined scores of the millions of college-bound seniors taking the SATs were approximately Normal with mean 1010 and standard deviation approximately 218. What percentage of all college-bound seniors had scores less than 820?
Question 13.27
13.27 More NCAA rules. For Division I athletes, the NCAA uses a sliding scale, based on both core GPA and the combined Mathematics and Critical Reading SAT score, to determine eligibility to compete in the first year of college. For athletes with a core GPA of 3.0, a score of at least 620 on the combined Mathematics and Critical Reading sections of the SAT exam is required. Use the information in the previous exercise to find the percentage of all SAT scores of college-bound seniors that are less than 620.
13.27 3.59%.
Question 13.28
13.28 800 on the SAT. It is possible to score higher than 800 on the SAT, but scores above 800 are reported as 800. (That is, a student can get a reported score of 800 without a perfect paper.) In 2014, the scores of college-bound senior men on the SAT Math test followed a Normal distribution with mean 530 and standard deviation 123. What percentage of scores were above 800 (and so reported as 800)?
Question 13.29
13.29 Women’s SAT scores. The average performance of women on the SAT, especially the math part, is lower than that of men. The reasons for this gender gap are controversial. In 2014, college-bound senior women’s scores on the SAT Math test followed a Normal distribution with mean 499 and standard deviation 114. The mean for men was 530. What percentage of women scored higher than the male mean?
13.29 38.21%.
Question 13.30
13.30 Are we getting smarter? When the Stanford-Binet IQ test came into use in 1932, it was adjusted so that scores for each age group of children followed roughly the Normal distribution with mean 100 and standard deviation 15. The test is readjusted from time to time to keep the mean at 100. If present-day American children took the 1932 Stanford-Binet test, their mean score would be about 120. The reasons for the increase in IQ over time are not known but probably include better childhood nutrition and more experience in taking tests.
(a) IQ scores above 130 are often called “very superior.” What percentage of children had very superior scores in 1932?
(b) If present-day children took the 1932 test, what percentage would have very superior scores? (Assume that the standard deviation 15 does not change.)
Question 13.31
13.31 Japanese IQ scores. The Wechsler Intelligence Scale for Children is used (in several languages) in the United States and Europe. Scores in each case are approximately Normally distributed with mean 100 and standard deviation of 15. When the test was standardized in Japan, the mean was 111. To what percentile of the American-European distribution of scores does the Japanese mean correspond?
13.31 Approximately the 76th percentile.
Question 13.32
13.32 The stock market. The annual rate of return on stock indexes (which combine many individual stocks) is very roughly Normal. Since 1945, the Standard & Poor’s 500 index has had a mean yearly return of 12.5%, with a standard deviation of 17.8%. Take this Normal distribution to be the distribution of yearly returns over a long period.
(a) In what range do the middle 95% of all yearly returns lie?
(b) The market is down for the year if the return on the index is less than zero. In what proportion of years is the market down?
(c) In what proportion of years does the index gain 25% or more?
Question 13.33
13.33 Locating the quartiles. The quartiles of any distribution are the 25th and 75th percentiles. About how many standard deviations from the mean are the quartiles of any Normal distribution?
13.33 Approximately 0.7 standard deviations from the mean.
Question 13.34
13.34 Young women’s heights. The heights of women aged 18–24 are approximately Normal with mean 65 inches and standard deviation 2.5 inches. How tall are the tallest 10% of women? (Use the closest percentile that appears in Table B.)
Question 13.35
13.35 High IQ scores. Scores on the Wechsler Adult Intelligence Scale for the 20 to 34 age group are approximately Normally distributed with mean 110 and standard deviation 15. How high must a person score to be in the top 10% of all scores?
13.35 About 130.

EXPLORING THE WEB
Follow the QR code to access exercises.