Normal distributions
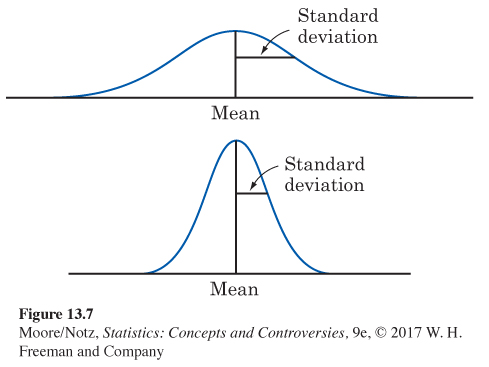
The density curves in Figures 13.3 and 13.4 belong to a particularly important family: the Normal curves. (We capitalize “Normal” to remind you that these curves are special.) Figure 13.7 presents two more Normal density curves. Normal curves are symmetric, single-peaked, and bell-shaped. Their tails fall off quickly, so we do not expect outliers. Because Normal distributions are symmetric, the mean and median lie together at the peak in the center of the curve.
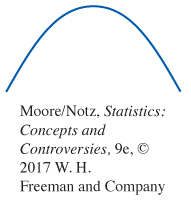
Normal curves also have the special property that we can locate the standard deviation of the distribution by eye on the curve. This isn’t true for most other density curves. Here’s how to do it. Imagine that you are skiing down a mountain that has the shape of a Normal curve. At first, you descend at an ever-steeper angle as you go out from the peak:
Fortunately, before you find yourself going straight down, the slope begins to grow flatter rather than steeper as you go out and down:
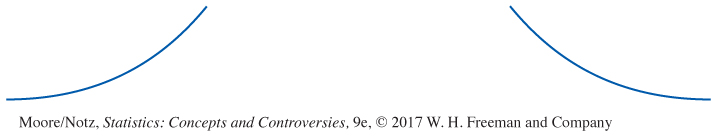
The points at which this change of curvature takes place are located one standard deviation on either side of the mean. The standard deviations are marked on the two curves in Figure 13.7. You can feel the change as you run a pencil along a Normal curve, and so find the standard deviation.
Normal curves have the special property that giving the mean and the standard deviation completely specifies the curve. The mean determines the center of the curve, and the standard deviation determines its shape. Changing the mean of a Normal distribution does not change its shape, only its location on the axis. Changing the standard deviation does change the shape of a Normal curve, as Figure 13.7 illustrates. The distribution with the smaller standard deviation is less variable and more sharply peaked. Here is a summary of basic facts about Normal curves.
Normal density curves
The Normal curves are symmetric, bell-shaped curves that have these properties:
• A specific Normal curve is completely described by giving its mean and its standard deviation.
• The mean determines the center of the distribution. It is located at the center of symmetry of the curve.
• The standard deviation determines the shape of the curve. It is the dis-tance from the mean to the change-of-curvature points on either side.
![]() The bell curve? Does the distribution of human intelligence follow the “bell curve” of a Normal distribution? Scores on IQ tests do roughly follow a Normal distribution. That is because a test score is calculated from a person’s answers in a way that is designed to produce a Normal distribution. To conclude that intelligence follows a bell curve, we must agree that the test scores directly measure intelligence. Many psychologists don’t think there is one human characteristic that we can call ‘‘intelligence’’ and can measure by a single test score.
The bell curve? Does the distribution of human intelligence follow the “bell curve” of a Normal distribution? Scores on IQ tests do roughly follow a Normal distribution. That is because a test score is calculated from a person’s answers in a way that is designed to produce a Normal distribution. To conclude that intelligence follows a bell curve, we must agree that the test scores directly measure intelligence. Many psychologists don’t think there is one human characteristic that we can call ‘‘intelligence’’ and can measure by a single test score.
Why are the Normal distributions important in statistics? First, Normal distributions are good descriptions for some distributions of real data. Normal curves were first applied to data by the great mathematician Carl Friedrich Gauss (1777–1855), who used them to describe the small errors made by astronomers and surveyors in repeated careful measurements of the same quantity. You will sometimes see Normal distributions labeled “Gaussian” in honor of Gauss. For much of the nineteenth century, Normal curves were called “error curves” because they were first used to describe the distribution of measurement errors. As it became clear that the distributions of some biological and psychological variables were at least roughly Normal, the “error curve” terminology was dropped. The curves were first called “Normal” by Francis Galton in 1889. Galton, a cousin of Charles Darwin, pioneered the statistical study of biological inheritance.
Normal curves also describe the distribution of statistics such as sample proportions (when the sample size is large and the value of the proportion is moderate) and sample means when we take many samples from the same population. We will explore distributions of statistics in more detail in later chapters. The margins of error for the results of sample surveys are usually calculated from Normal curves. However, even though many sets of data follow a Normal distribution, many do not. Most income distributions, for example, are skewed to the right and so are not Normal. Non-Normal data, like nonnormal people, not only are common but are sometimes more interesting than their normal counterparts.