15.1 Describing Relationships: Regression, Prediction, and Causation
15
Describing Relationships: Regression, Prediction, and Causation

CASE STUDY Predicting the future course of the stock market could make you rich. No wonder lots of people and lots of computers pore over market data looking for patterns.
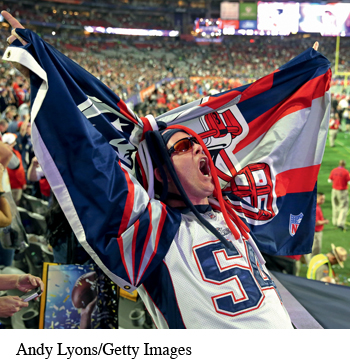
There are some surprising methods. The “Super Bowl Indicator” says that the football Super Bowl, played in January or early February, predicts how stocks will behave each year. The current National Football League (NFL) was formed by merging the original NFL with the American Football League (AFL). The current NFL consists of two conferences, the National Football Conference (NFC) and the American Football Conference (AFC). The indicator claims that stocks go up in years when a team from the NFC (or from the old NFL) wins and down when an AFC team wins. The indicator was right in 39 of 49 years between the first Super Bowl in 1967 and 2015. (For purposes of the legend, we will regard the Baltimore Ravens as an old NFL team because they were the Cleveland Browns before the franchise moved to Baltimore in 1996. We will also regard the Tampa Bay Buccaneers as an NFC team, although they were neither a pre-merger team nor an old NFL team and started out as an AFC team.) The indicator is right more than 75% of the time, which seems impressive.
In 2016 (the year in which this was written), the Broncos, an AFC team, won the Super Bowl. According to the Super Bowl Indicator, stocks will fall in 2016. Should I have avoided investing in 2016?
In this chapter, we will study statistical methods to predict one variable from others that go well beyond just counting ups and downs. We will also distinguish between the ability to predict one variable from others and the issue of whether changes in one variable are caused by changes in others. By the end of this chapter, you will be able to critically evaluate the Super Bowl Indicator.