Myths about chance behavior
The idea of probability seems straightforward. It answers the question, “What would happen if we did this many times?” In fact, both the behavior of random phenomena and the idea of probability are a bit subtle. We meet chance behavior constantly, and psychologists tell us that we deal with it poorly.
The myth of short-run regularity The idea of probability is that randomness is regular in the long run. Unfortunately, our intuition about randomness tries to tell us that random phenomena should also be regular in the short run. When they aren’t, we look for some explanation other than chance variation.
EXAMPLE 4 What looks random?
Toss a fair coin six times and record heads (H) or tails (T) on each toss. Which of these outcomes is most probable?
HTHTTH HHHTTT TTTTTT
Almost everyone says that HTHTTH is more probable because TTTTTT and HHHTTT do not “look random.” In fact, all three are equally probable. That heads and tails are equally probable says all specific outcomes of heads and tails in six tosses are equally likely. That heads and tails are equally probable says only that about half of a very long sequence of tosses will be heads. This is because in very long sequences of tosses, the number of outcomes for which the proportion of heads is approximately one-half is much larger that the number of outcomes for which the proportion is not near one-half. That heads and tails are equally probable doesn’t say that heads and tails must come close to alternating in the short run. It doesn’t say that specific outcomes that balance the number of heads and tails are more likely than specific outcomes that don’t. The coin has no memory. It doesn’t know what past outcomes were, and it can’t try to create a balanced sequence.
The outcome TTTTTT in tossing six coins looks unusual because of the run of six straight tails. The outcome HHHTTT also looks unusual because of the pattern of a run of three straight heads followed by a run of three straight tails. Runs seem “not random” to our intuition but are not necessarily unusual. Here’s an example more striking than tossing coins.

EXAMPLE 5 The hot hand in basketball
Belief that runs must result from something other than “just chance” influences behavior. If a basketball player makes several consecutive shots, both the fans and his teammates believe that he has a “hot hand” and is more likely to make the next shot. This is not supported by data. Careful study has shown that runs of baskets made or missed are no more frequent in basketball than would be expected if each shot were independent of the player’s previous shots. Players perform consistently, not in streaks. If a player makes half her shots in the long run, her hits and misses behave just like tosses of a coin—and that means that runs of hits and misses are more common than our intuition expects.
NOW IT’S YOUR TURN
Question 17.1
17.1 Coin tossing and randomness. Toss a coin 10 times and record heads (H) or tails (T) on each toss. Which of these outcomes is most probable? Least probable?
HTHTTHHTHT TTTTTHHHHH HHHHHHHHHH
The myth of the surprising coincidence On November 18, 2006, Ohio State beat Michigan in football by a score of 42 to 39. Later that day, the winning numbers in the Pick 4 Ohio lottery were 4239. What an amazing coincidence!
Well, maybe not. It is certainly unlikely that the Pick 4 lottery would match the Ohio State versus Michigan score that day, but it is not so unlikely that sometime during the 2006 season, the winning number of some state lottery would match the recent score of some professional, college, or high school football game involving a team in the state. There are 32 NFL teams, 235 NCAA Division I teams, 150 NCAA Division II teams, and 231 NCAA Division III teams. There are also more than 25,000 high school football teams. All play a number of games during the season. There are 38 states with a Pick 3 or Pick 4 lottery game, with winning numbers often drawn multiple times per week. That’s a lot of opportunities to match a Pick 3 or Pick 4 lottery number that has digits that could conceivably be a football score like 217 or 4239.
When something unusual happens, we look back and say, “Wasn’t that unlikely?” We would have said the same if any of thousands of other unlikely things had happened. Here’s an example where it was possible to actually calculate the probabilities.

EXAMPLE 6 Winning the lottery twice
In 1986, Evelyn Marie Adams won the New Jersey State lottery for the second time, adding $1.5 million to her previous $3.9 million jackpot. The New York Times (February 14, 1986) claimed that the odds of one person winning the big prize twice were about 1 in 17 trillion. Nonsense, said two statistics professors in a letter that appeared in the Times two weeks later. The chance that Evelyn Marie Adams would win twice in her lifetime is indeed tiny, but it is almost certain that someone among the millions of regular lottery players in the United States would win two jackpot prizes. The statisticians estimated even odds (a probability of one-half) of another double winner within seven years. Sure enough, Robert Humphries won his second Pennsylvania lottery jackpot ($6.8 million total) in May 1988. You might find it interesting to do an Internet search of “man wins state lottery two times” or “woman wins state lottery two times.” A recent double winner was a man who won the Florida State lottery for the second time on August 31, 2013.
Unusual events—especially distressing events—bring out the human desire to pinpoint a reason, a cause. Here’s a sequel to our earlier discussion of causation: sometimes it’s just the play of chance.
EXAMPLE 7 Cancer clusters
Between 1996 and 2013, 37 children in Clyde, Ohio, a town of 6000 halfway between Toledo and Cleveland, were diagnosed with cancer. Four of the children had died. With many of the diagnoses coming between 2002 and 2006, state health authorities declared it a cancer cluster, saying the number and type of diagnoses exceed what would be expected statistically for so small a population over that time. In the fall of 2012, the EPA found high levels of toxic, possibly cancer-causing chemical compounds in soil samples from Whirlpool Park, formerly a residential area owned by home appliance manufacturer Whirlpool Corp from the 1950s until 2008. Locals told news reporters that “black sludge” had been dumped in the area during that time. However, as recently as 2009, state agencies had conducted tests in the area and found that levels of contamination were not high enough to endanger the lives of nearby residents.
Between 1997 and 2004, 16 children were diagnosed with cancer and three died in Fallon, Nevada, a farming community of 8300 some 60 miles southeast of Reno. This is an unusual number of cases for such a small town. Residents were concerned that perhaps high levels of naturally occurring arsenic in Fallon’s water supply, a pipeline carrying jet fuel to the local Navy base, local pesticide spraying, high tungsten levels, or an underground nuclear test conducted 30 miles away about 40 years ago might be responsible. However, scientists were unable to link any of these to the cancers. Residents were disappointed by the scientists’ findings.
In 1984, residents of a neighborhood in Randolph, Massachusetts, counted 67 cancer cases in their 250 residences. This cluster of cancer cases seemed unusual, and the residents expressed concern that runoff from a nearby chemical plant was contaminating their water supply and causing cancer.
In 1979, two of the eight town wells serving Woburn, Massachusetts, were found to be contaminated with organic chemicals. Alarmed citizens began counting cancer cases. Between 1964 and 1983, 20 cases of childhood leukemia were reported in Woburn. This is an unusual number of cases of this rather rare disease. The residents believed that the well water had caused the leukemia and proceeded to sue two companies held responsible for the contamination.
![]() The probability of rain is . . . You work all week. Then it rains on the weekend. Can there really be a statistical truth behind our perception that the weather is against us? At least on the East Coast of the United States, the answer is Yes. Going back to 1946, it seems that Sundays receive 22% more precipitation than Mondays. The likely explanation is that the pollution from all those workday cars and trucks forms the seeds for raindrops—with just enough delay to cause rain on the weekend.
The probability of rain is . . . You work all week. Then it rains on the weekend. Can there really be a statistical truth behind our perception that the weather is against us? At least on the East Coast of the United States, the answer is Yes. Going back to 1946, it seems that Sundays receive 22% more precipitation than Mondays. The likely explanation is that the pollution from all those workday cars and trucks forms the seeds for raindrops—with just enough delay to cause rain on the weekend.
Cancer is a common disease, accounting for more than 23% of all deaths in the United States. That cancer cases sometimes occur in clusters in the same neighborhood is not surprising; there are bound to be clusters somewhere simply by chance. But when a cancer cluster occurs in our neighborhood, we tend to suspect the worst and look for someone to blame. State authorities get several thousand calls a year from people worried about “too much cancer” in their area. But the National Cancer Institute finds that the majority of reported cancer clusters are simply the result of chance.
Both of the Massachusetts cancer clusters were investigated by statisticians from the Harvard School of Public Health. The investigators tried to obtain complete data on everyone who had lived in the neighborhoods in the periods in question and to estimate their exposure to the suspect drinking water. They also tried to obtain data on other factors that might explain cancer, such as smoking and occupational exposure to toxic substances. The verdict: chance is the likely explanation of the Randolph cluster, but there is evidence of an association between drinking water from the two Woburn wells and developing childhood leukemia.
The myth of the law of averages Roaming the gambling floors in Las Vegas, watching money disappear into the drop boxes under the tables, is revealing. You can see some interesting human behavior in a casino. When the shooter in the dice game craps rolls several winners in a row, some gamblers think she has a “hot hand” and bet that she will keep on winning. Others say that “the law of averages” means that she must now lose so that wins and losses will balance out. Believers in the law of averages think that if you toss a coin six times and get TTTTTT, the next toss must be more likely to give a head. It’s true that in the long run heads must appear half the time. What is myth is that future outcomes must make up for an imbalance like six straight tails.
Coins and dice have no memories. A coin doesn’t know that the first six outcomes were tails, and it can’t try to get a head on the next toss to even things out. Of course, things do even out in the long run. After 10,000 tosses, the results of the first six tosses don’t matter. They are overwhelmed by the results of the next 9994 tosses, not compensated for.
EXAMPLE 8 We want a boy
Belief in this phony “law of averages” can lead to consequences close to disastrous. A few years ago, “Dear Abby” published in her advice column a letter from a distraught mother of eight girls. It seems that she and her husband had planned to limit their family to four children. When all four were girls, they tried again—and again, and again. After seven straight girls, even her doctor had assured her that “the law of averages was in our favor 100 to 1.” Unfortunately for this couple, having children is like tossing coins. Eight girls in a row is highly unlikely, but once seven girls have been born, it is not at all unlikely that the next child will be a girl—and it was.
What is the law of averages? Is there a “law of averages”? There is, although it is sometimes referred to as the “law of large numbers.” It states that in a large number of “independent” repetitions of a random phenomenon (such as coin tossing), averages or proportions are likely to become more stable as the number of trials increases, whereas sums or counts are likely to become more variable. This does not happen by compensation for a run of bad luck because, by “independent,” we mean that knowing the outcome of one trial does not change the probabilities for the outcomes of any other trials. The trials have no memory.
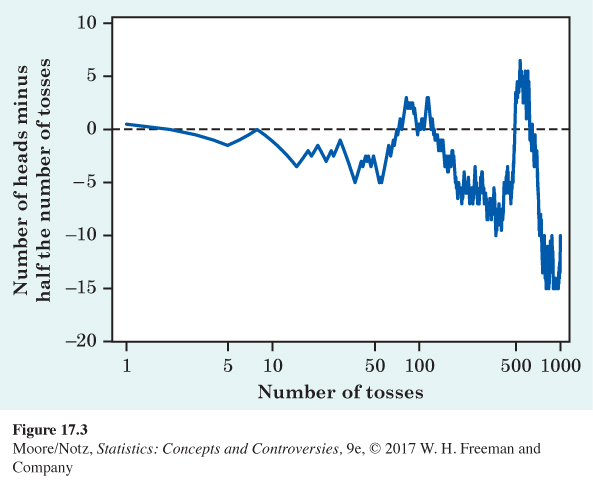
Figures 17.1 and 17.3 show what happens when we toss a coin repeatedly many times. In Figure 17.1, we see that the proportion of heads gradually becomes closer and closer to 0.5 as the number of tosses increases. This illustrates the law of large numbers. However, Figure 17.3 shows, for these same tosses, how far the total number of heads differs from exactly half of the tosses being heads. We see that this difference varies more and more as the number of tosses increases. The law of large numbers does not apply to sums or counts.
It is not uncommon to see the law of averages misstated in terms of the sums or counts rather than means or proportions. For example, assuming that the birthrates for boys and girls in the United States are equal, you may hear someone state that the total number of males and females in the United States should be nearly equal rather than stating that the proportion of males and females in the United States should be nearly equal.
NOW IT’S YOUR TURN
Question 17.2
17.2 Coin tossing and the law of averages. The author C. S. Lewis once wrote the following, referring to the law of averages: “If you tossed a coin a billion times, you could predict a nearly equal number of heads and tails.” Is this a correct statement of the law of averages? If not, how would you rewrite the statement so that it is correct?
17.2 A correct statement might be, “If you tossed a coin a billion times, you could predict a nearly equal proportion of heads and tails.”