CHAPTER 18 EXERCISES
Question 18.8
18.8 Moving up. A sociologist studying social mobility in Denmark finds that the probability that the son of a lower-class father remains in the lower class is 0.46. What is the probability that the son moves to one of the higher classes?
Question 18.9
18.9 Causes of death. Government data assign a single cause for each death that occurs in the United States. Data from 2013 show that the probability is 0.31 that a randomly chosen death was due to heart disease and 0.23 that it was due to cancer. What is the probability that a death was due either to heart disease or to cancer? What is the probability that the death was due to some other cause?
18.9 0.54; 0.46.
Question 18.10
18.10 Land in Canada. Choose an acre of land in Canada at random. The probability is 0.45 that it is forest and 0.03 that it is pasture.
(a) What is the probability that the acre chosen is not forested?
(b) What is the probability that it is either forest or pasture?
(c) What is the probability that a randomly chosen acre in Canada is something other than forest or pasture?
Question 18.11
 18.11 Our favorite president. A Gallup Poll on Presidents’ Day 2011 interviewed a random sample of 1015 adult Americans. Those in the sample were asked who they regarded as the greatest U.S. president. Here are the results:
| Outcome | Probability |
| Ronald Reagan | 0.19 |
| Abraham Lincoln | 0.14 |
| Bill Clinton | 0.13 |
| John F. Kennedy | 0.11 |
| Someone else | ? |
These proportions are probabilities for the random phenomenon of choosing an adult American at random and asking her or his opinion.
(a) What must be the probability that the person chosen selects someone other than Ronald Reagan, Abraham Lincoln, Bill Clinton, or John F. Kennedy? Why?
(b) The event “I would select either Ronald Reagan or Abraham Lincoln” contains the first two outcomes. What is its probability?
18.11 (a) 0.43 Because some outcome must occur on every trial, the sum of the probabilities for all possible outcomes must be exactly 1. (b) 0.33.
Question 18.12
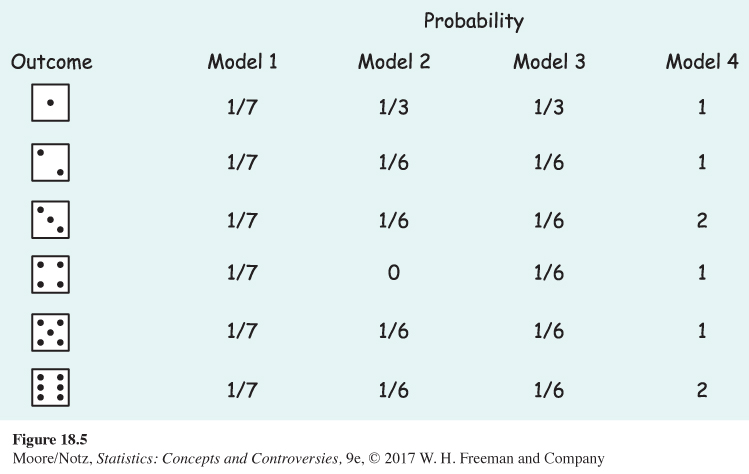
18.12 Rolling a die. Figure 18.5 displays several assignments of probabilities to the six faces of a die. We can learn which assignment is actually correct for a particular die only by rolling the die many times. However, some of the assignments are not legitimate assignments of probability. That is, they do not obey the rules. Which are legitimate and which are not? In the case of the illegitimate models, explain what is wrong.
Question 18.13
18.13 The demands of college. Select a first-year college student at random and ask how difficult it was for him or her to adjust to the academic demands of college. Here are the probabilities, based on proportions from a large sample survey in 2010 of first-year students:
| Difficulty: | Very difficult | Somewhat difficult |
| Probability: | 0.05 | 0.31 |
| Difficulty: | Somewhat easy | Very easy |
| Probability: | 0.44 | 0.20 |
(a) What is the sum of these probabilities? Why do you expect the sum to have this value?
(b) What is the probability that a randomly chosen first-year college student did not find it very difficult to adjust to the academic demands of college?
(c) What is the probability that a first-year student found it very or somewhat difficult to adjust to the academic demands of college?
18.13 (a) 1. Because some outcome must occur on every trial, the sum of the probabilities for all possible outcomes must be exactly 1. (b) .95. (c) .36.
Question 18.14
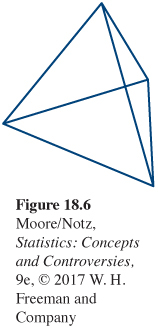
18.14 Tetrahedral dice. Psychologists sometimes use tetrahedral dice to study our intuition about chance behavior. A tetrahedron (Figure 18.6) is a pyramid with four faces, each a triangle with all sides equal in length. Label the four faces of a tetrahedral die with one, two, three, and four spots. Give a probability model for rolling such a die and recording the number of spots on the down-face. Explain why you think your model is at least close to correct.
Question 18.15
18.15 Birth order. A couple plan to have three children. There are eight possible arrangements of girls and boys. For example, GGB means the first two children are girls and the third child is a boy. All eight arrangements are (approximately) equally likely.
(a) Write down all eight arrangements of the sexes of three children. What is the probability of any one of these arrangements?
(b) What is the probability that the couple’s children are two girls and one boy?
18.15 (a) BBB, BBG, BGB, GBB, GGB, GBG, BGG, GGG. Each has probability 1/8. (b) 3/8 = 0.375.
Question 18.16
18.16 More tetrahedral dice. Tetrahedral dice are described in Exercise 18.14. Give a probability model for rolling two such dice. That is, write down all possible outcomes and give a probability to each. (Example 2 and Figure 18.1 may help you.) What is the probability that the sum of the down-faces is 5?
Question 18.17
18.17 Roulette. A roulette wheel has 38 slots, numbered 0, 00, and 1 to 36. The slots 0 and 00 are colored green, 18 of the others are red, and 18 are black. The dealer spins the wheel and, at the same time, rolls a small ball along the wheel in the opposite direction. The wheel is carefully balanced so that the ball is equally likely to land in any slot when the wheel slows. Gamblers can bet on various combinations of numbers and colors.
(a) What is the probability of any one of the 38 possible outcomes? Explain your answer.
(b) If you bet on “red,” you win if the ball lands in a red slot. What is the probability of winning?
(c) A friend tells you that the odds that a bet on “red” will win are 10 to 9. Is your friend correct? If not, what are the correct odds?
(d) The slot numbers are laid out on a board on which gamblers place their bets. One column of numbers on the board contains all multiples of 3, that is, 3, 6, 9, . . ., 36. You place a “column bet” that wins if any of these numbers comes up. What is your probability of winning?
18.17 (a) 1/38 since all outcomes are equally likely. (b) 18/38 (c) 10 to 9 are the correct odds. (d) 12/38
Question 18.18
18.18 Colors of M&M’s. If you draw an M&M candy at random from a bag of the candies, the candy you draw will have one of six colors. The probability of drawing each color depends on the proportion of each color among all candies made.
(a) Here are the probabilities of each color for a randomly chosen plain M&M:
Color: Blue Orange Green Probability: 0.24 0.20 0.16 Color: Yellow Red Brown Probability: 0.14 0.13 ? What must be the probability of drawing a brown candy?
(b) The probabilities for peanut M&M’s are a bit different. Here they are:
Color: Blue Orange Green Probability: 0.23 0.23 0.15 Color: Yellow Brown Red Probability: 0.15 0.13 ? What is the probability that a peanut M&M chosen at random is red?
(c) What is the probability that a plain M&M is any of blue, yellow, or orange? What is the probability that a peanut M&M has one of these colors?
Question 18.19
18.19 Legitimate probabilities? In each of the following situations, state whether or not the given assignment of probabilities to individual outcomes is legitimate, that is, whether it satisfies the rules of probability. If not, give specific reasons for your answer.
(a) When a coin is spun, P(H) = 0.55 and P(T) = 0.45.
(b) When two coins are tossed, P(HH) = 0.4, P(HT) = 0.4, P(TH) = 0.4, and P(TT) = 0.4.
(c) Plain M&M’s have not always had the mixture of colors given in Exercise 18.18. In the past, there were no red candies and no blue candies. Tan had probability 0.10, and the other four colors had the same probabilities that are given in Exercise 18.13.
18.19 (a) Legitimate. (b) Not legitimate. The sum of the probabilities for all possible outcomes is not 1. (c) Not legitimate. The sum of the probabilities for all possible outcomes is not 1.
Question 18.20
18.20 Immigration. Suppose that 34% of all adult Americans think that the level of immigration to the United States should be decreased. An opinion poll interviews 1020 randomly chosen Americans and records the sample proportion who feel that the level of immigration to this country should be decreased. This statistic will vary from sample to sample if the poll is repeated. The sampling distribution is approximately Normal with mean 0.34 and standard deviation about 0.015. Sketch this Normal curve and use it to answer the following questions.
(a) The mean of the population is 0.34. In what range will the middle 95% of all sample results fall?
(b) What is the probability that the poll gets a sample in which fewer than 32.5% say the level of immigration to this country should be decreased?
Question 18.21
18.21 Airplane safety. Suppose that 73% of all adults think that the overall safety of airline travel is either good or excellent. An opinion poll plans to ask an SRS of 1097 adults about airplane safety. The proportion of the sample who think that the overall safety of airline travel is either good or excellent will vary if we take many samples from this same population. The sampling distribution of the sample proportion is approximately Normal with mean 0.73 and standard deviation about 0.013. Sketch this Normal curve and use it to answer the following questions.
(a) What is the probability that the poll gets a sample in which more than 75.6% of the people think that airplanes would be safer if passengers were banned from carrying on board any luggage, including purses, computers, and briefcases?
(b) What is the probability of getting a sample that misses the truth (73%) by 2.6% or more?
18.21 (a) 0.025. (b) 0.05.
Question 18.22
18.22 Immigration (optional). In the setting of Exercise 18.20, what is the probability of getting a sample in which less than 30% of those sampled think that the level of immigration to this country should be decreased? (Use Table B.)
Question 18.23
18.23 Airplane safety (optional). In the setting of Exercise 18.21, what is the probability of getting a sample in which more than 75% think that the overall safety of airline travel is either good or excellent? (Use Table B.)
18.23 0.0668.
Question 18.24
18.24 Do you jog? An opinion poll asks an SRS of 1500 adults, “Do you happen to jog?” Suppose (as is approximately correct) that the population proportion who jog is p = 0.15. In a large number of samples, the proportion ˆp who answer Yes will be approximately Normally distributed with mean 0.15 and standard deviation 0.009. Sketch this Normal curve and use it to answer the following questions.
(a) What percentage of many samples will have a sample proportion who jog that is 0.15 or less? Explain clearly why this percentage is the probability that ˆp is 0.15 or less.
(b) What is the probability that ˆp will take a value between 0.141 and 0.159? (Use the 68–95–99.7 rule.)
(c) Now use Rule C for probability: what is the probability that ˆp does not lie between 0.141 and 0.159?
Question 18.25
18.25 Applying to college. You ask an SRS of 1500 college students whether they applied for admission to any other college. Suppose that, in fact, 35% of all college students applied to colleges besides the one they are attending. (That’s close to the truth.) The sampling distribution of the proportion ˆp of your sample who say Yes is approximately Normal with mean 0.35 and standard deviation 0.01. Sketch this Normal curve and use it to answer the following questions.
(a) Explain in simple language what the sampling distribution tells us about the results of our sample.
(b) What percentage of many samples would have a ˆp larger than 0.37? (Use the 68–95–99.7 rule.) Explain in simple language why this percentage is the probability of an outcome larger than 0.37.
(c) What is the probability that your sample will have a ˆp less than 0.33?
(d) Use Rule D: what is the probability that your sample result will be either less than 0.33 or greater than 0.35?
18.25 (a) The sampling distribution tells us the pattern of values of ˆp among many samples from the population. (b) 0.025. It is the (theoretical) relative frequency out of a large number of trials. (c) 0.025. (d) 0.525.
Question 18.26
18.26 Generating a sampling distribution. Let us illustrate the idea of a sampling distribution in the case of a very small sample from a very small population. The population is the scores of 10 students on an exam:
| Student: | 0 | 1 | 2 | 3 | 4 |
| Score: | 82 | 62 | 80 | 58 | 72 |
| Student: | 5 | 6 | 7 | 8 | 9 |
| Score: | 73 | 65 | 66 | 74 | 62 |
The parameter of interest is the mean score in this population. The sample is an SRS of size n=4 drawn from the population. Because the students are labeled 0 to 9, a single random digit from Table A chooses one student for the sample.
(a) Find the mean of the 10 scores in the population. This is the population mean.
(b) Use Table A to draw an SRS of size 4 from this population. Write the four scores in your sample and calculate the mean ˉx of the sample scores. This statistic is an estimate of the population mean.
(c) Repeat this process 10 times using different parts of Table A. Make a histogram of the 10 values of ˉx. You are constructing the sampling distribution of ˉx. Is the center of your histogram close to the population mean you found in part (a)?
Question 18.27
18.27 Odds and personal probability. One way to determine your personal probability about an event is to ask what you would consider a fair bet that the event will occur. Suppose in August 2015 you believed it fair that a bet of $2 should win $7 if the Green Bay Packers win Super Bowl 50.
(a) What does this bet say you believe the odds to be that the Green Bay Packers will win Super Bowl 50?
(b) Convert the odds in part (a) to a probability. This would be your personal probability that the Green Bay Packers will win Super Bowl 50.
18.27 (a) 7 to 2. (b) 2/9.
Question 18.28
18.28 The addition rule. Probability rule D states: If two events have no outcomes in common, the probability that one or the other occurs is the sum of their individual probabilities. This is sometimes called the addition rule for disjoint events. A more general form of the addition rule is: the probability that one or the other of two events occurs is the sum of their individual probabilities minus the probability that both occur. To verify this rule, suppose you roll two casino dice as in Example 2. Refer to the outcomes in Figure 18.1 to answer the following.
(a) How many of the outcomes in Figure 18.1 have the sum of the spots on the up-faces equal to 6? What is the probability that the sum of the spots on the up-faces is 6?
(b) How many of the outcomes in Figure 18.1 have at least one of the up-faces showing a single spot? What is the probability that at least one of the up-faces has only a single spot?
(c) How many of the outcomes in Figure 18.1 have the sum of the spots on the up-faces equal to 6 and at least one of the up-faces showing a single spot? What is the probability that the sum of the spots on the up-faces is 6 and at least one of the up-faces has only a single spot?
(d) How many of the outcomes in Figure 18.1 have either the sum of the spots on the up-faces equal to 6 or have at least one of the up-faces showing a single spot? What is the probability that the sum of the spots on the up-faces is either a 6 or at least one of the up-faces has a single spot?
(e) The addition rule says that your answer to part (d) should be equal to the sum of your answers to parts (a) and (b) minus your answer to part (c). Verify that this is the case.
Note: The outcomes you were asked to count in part (c) are among those counted in parts (a) and (b). When we combine the outcomes in parts (a) and (b), we “double count” the outcomes in part (c). One of these “double counts” must be eliminated so that the combination corresponds to the outcomes in part (d). This is the reason that, in the addition rule, you subtract the probability that both occur from the sum of their individual probabilities.

EXPLORING THE WEB
Follow the QR code to access exercises.