More on confidence intervals for a population proportion*
We used the 95 part of the 68–95–99.7 rule to get a 95% confidence interval for the population proportion. Perhaps you think that a method that works 95% of the time isn’t good enough. You want to be 99% confident. For that, we need to mark off the central 99% of a Normal distribution. For any probability C between 0 and 1, there is a number z* such that any Normal distribution has probability C within z* standard deviations of the mean. Figure 21.5 shows how the probability C and the number z* are related.
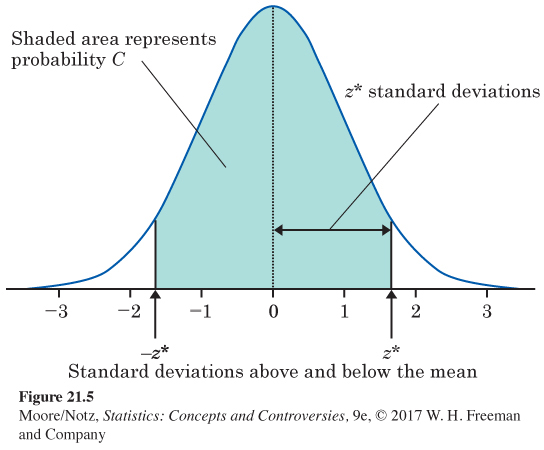
Table 21.1 gives the numbers z* for various choices of C. For convenience, the table gives C as a confidence level in percent. The numbers z* are called critical values of the Normal distribution. Table 21.1 shows that any Normal distribution has probability 99% within ±2.58 standard deviations of its mean. The table also shows that any Normal distribution has probability 95% within ±1.96 standard deviations of its mean. The 68–95–99.7 rule uses 2 in place of the critical value z* = 1.96. That is good enough for practical purposes, but the table gives the more exact value.
| Confidence level C |
Critical value z* |
Confidence level C |
Critical value z* |
|---|---|---|---|
| 50% | 0.67 | 90% | 1.64 |
| 60% | 0.84 | 95% | 1.96 |
| 70% | 1.04 | 99% | 2.58 |
| 80% | 1.28 | 99.9% | 3.29 |
From Figure 21.5 we see that, with probability C, the sample proportion ˆp takes a value within z* standard deviations of p. That is just to say that, with probability C, the interval extending z* standard deviations on either side of the observed ˆp captures the unknown p. Using the estimated standard deviation of ˆp produces the following recipe.
Confidence interval for a population proportion
Choose an SRS of size n from a population of individuals of which proportion p are successes. The proportion of successes in the sample is ˆp. When n is large, an approximate level C confidence interval for p is
ˆp±z*√ˆp(1−ˆp)n
where z* is the critical value for probability C from Table 21.1.
EXAMPLE 5 A 99% confidence interval
The Gallup random sample of 1009 adult Americans in 2015 found that 616 reported actively trying to avoid drinking regular soda or pop. We want a 99% confidence interval for the proportion p of all adult Americans who actively avoided drinking regular soda or pop. Table 21.1 says that for 99% confidence, we must go out z* = 2.58 standard deviations. Here are our calculations:
ˆp=6161009=0.611
ˆp±z*√ˆp(1−ˆp)n=0.611±2.58√(0.611)(0.389)1009
= 0.611 ± (2.58)(0.0153)
= 0.611 ± 0.0395
= 0.5715 to 0.6505
We are 99% confident that the true population proportion is between 57.15% and 65.05%. That is, we got this range of percentages by using a method that gives a correct answer 99% of the time.
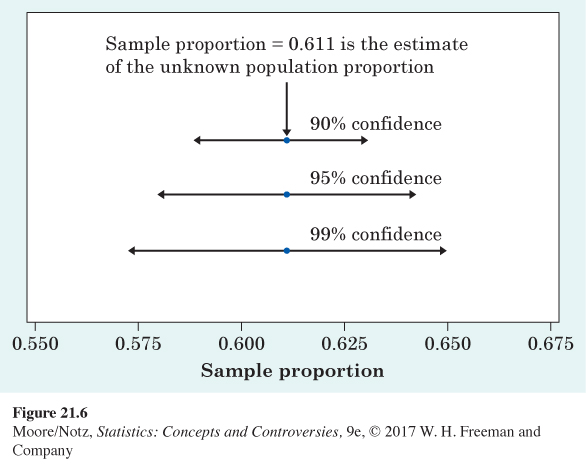
Compare Example 5 with the calculation of the 95% confidence interval in Example 3. The only difference is the use of the critical value 2.58 for 99% confidence in place of 2 for 95% confidence. That makes the margin of error for 99% confidence larger and the confidence interval wider. Higher confidence isn’t free—we pay for it with a wider interval. Figure 21.5 reminds us why this is true. To cover a higher percentage of the area under a Normal curve, we must go farther out from the center. Figure 21.6 compares the lengths of the 90%, 95%, and 99% confidence intervals.
NOW IT’S YOUR TURN
Question 21.2
21.2 Gambling. A May 2011 Gallup Poll consisting of a random sample of 1018 adult Americans found that 31% believe that gambling is morally wrong. Find a 99% confidence interval for the proportion of all adult Americans who believe that gambling is morally wrong. How would you interpret this interval?
21.2 The 99% confidence interval for the proportion of all adult Americans who believe gambling is morally wrong is
ˆp±2√ˆp(1−ˆp)n=0.31±2.58√0.31(0.69)1018=0.31±2.58(0.014)=0.31±0.036=0.274 to 0.346
Interpret this result as follows: we got this interval by using a recipe that catches the true unknown population proportion 99% of the time. The shorthand is, we are 99% confident that the true proportion of adult Americans who believe gambling is morally wrong lies between 27.4% and 34.6%.
*This section is optional.