The reasoning of statistical tests of significance
The local hot-
Statistical inference uses data from a sample to draw conclusions about a population. So, once we leave the playground, statistical tests deal with claims about a population. Statistical tests ask if sample data give good evidence against a claim. A statistical test says, “If we took many samples and the claim were true, we would rarely get a result like this.’’ To get a numerical measure of how strong the sample evidence is, replace the vague term “rarely’’ by a probability. Here is an example of this reasoning at work.
EXAMPLE 1 Is the coffee fresh?
People of taste are supposed to prefer fresh-
Each of 50 subjects tastes two unmarked cups of coffee and says which he or she prefers. One cup in each pair contains instant coffee; the other, fresh-
ˆp=3650=0.72=72%
To make a point, let’s compare our outcome ˆp=0.72 with another possible result. If only 28 of the 50 subjects like the fresh coffee better than instant coffee, the sample proportion is
ˆp=2850=0.56=56%
Surely 72% is stronger evidence against the skeptic’s claim than 56%. But how much stronger? Is even 72% in favor in a sample convincing evidence that a majority of the population prefer fresh coffee? Statistical tests answer these questions. Here’s the answer in outline form:
• The claim. The skeptic claims that coffee drinkers can’t tell fresh from instant so that only half will choose fresh-
brewed coffee. That is, he claims that the population proportion p is only 0.5. Suppose for the sake of argument that this claim is true. • The sampling distribution (from page 495). If the claim p = 0.5 were true and we tested many random samples of 50 coffee drinkers, the sample proportion ˆp would vary from sample to sample according to (approximately) the Normal distribution with
mean = p = 0.5
and
standard deviation=p(1–
= 0.0707
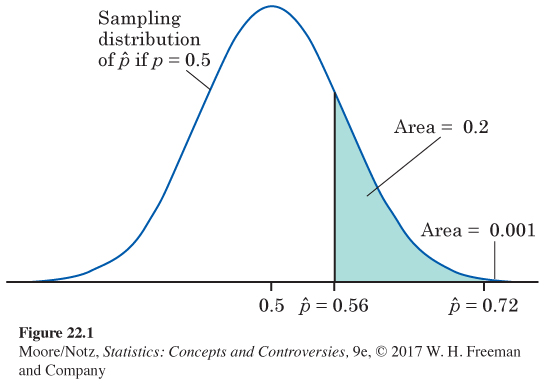
Figure 22.1 displays this Normal curve.

• The data. Place the sample proportion on the sampling distribution. You see in Figure 22.1 that isn’t an unusual value but that is unusual. We would rarely get 72% of a sample of 50 coffee drinkers preferring fresh-
brewed coffee if only 50% of all coffee drinkers felt that way. So, the sample data do give evidence against the claim. • The probability. We can measure the strength of the evidence against the claim by a probability. What is the probability that a sample gives a this large or larger if the truth about the population is that p = 0.5? If , this probability is the shaded area under the Normal curve in Figure 22.1. This area is 0.20. Our sample actually gave . The probability of getting a sample outcome this large is only 0.001, an area too small to see in Figure 22.1. An outcome that would occur just by chance in 20% of all samples is not strong evidence against the claim. But an outcome that would happen only 1 in 1000 times is good evidence.
Be sure you understand why this evidence is convincing. There are two possible explanations of the fact that 72% of our subjects prefer fresh to instant coffee:
1. The skeptic is correct (p = 0.5), and by bad luck a very unlikely outcome occurred.
2. In fact, the population proportion favoring fresh coffee is greater than 0.5, so the sample outcome is about what would be expected.
We cannot be certain that Explanation 1 is untrue. Our taste test results could be due to chance alone. But the probability that such a result would occur by chance is so small (0.001) that we are quite confident that Explanation 2 is right.