Significance at the 5% level isn’t magical
The purpose of a test of significance is to describe the degree of evidence provided by the sample against the null hypothesis. The P-value does this. But how small a P-value is convincing evidence against the null hypothesis? This depends mainly on two circumstances:
• How plausible is H0? If H0 represents an assumption that the people you must convince have believed for years, strong evidence (small P) will be needed to persuade them.
• What are the consequences of rejecting H0? If rejecting H0 in favor of Ha means making an expensive changeover from one type of product packaging to another, you need strong evidence that the new packaging will boost sales.
STATISTICAL CONTROVERSIES
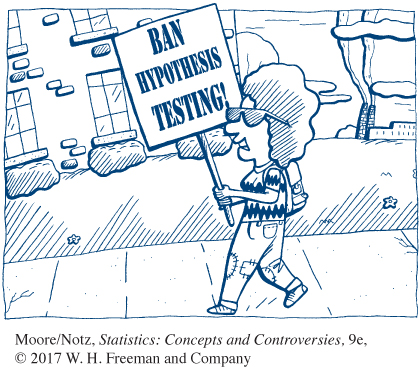
Should Hypothesis Tests Be Banned?
In January 2015, the editors of Basic and Applied Social Psychology (BASP) banned “null hypothesis significance testing procedures (NHSTP).” NHSTP is a fancy way to talk about the hypothesis testing we studied in Chapter 22. In addition to the ban on NHSTP, authors submitting articles to BASP must remove all test statistics, P-
What does BASP want to see from its future authors? According to the editorial, “BASP will require strong descriptive statistics, including effect sizes,” and suggests using (but will not mandate) larger sample sizes than are typical in psychological research “because as the sample size increases, descriptive statistics become increasingly stable and sampling error is less of a problem.”
The editorial concludes with the editors stating that they hope other journals will join the BASP ban on NHSTP.
What is your reaction to the ban on hypothesis testing by BASP? How does the approach suggested by the editors compare with the practices that we have emphasized in this book?

These criteria are a bit subjective. Different people will often insist on different levels of significance. Giving the P-value allows each of us to decide individually if the evidence is sufficiently strong. But the level of significance that will satisfy us should be decided before calculating the P-value. Computing the P-value and then deciding that we are satisfied with a level of significance that is just slightly larger than this P-value is an abuse of significance testing.
Users of statistics have often emphasized standard levels of significance such as 10%, 5%, and 1%. For example, courts have tended to accept 5% as a standard in discrimination cases. This emphasis reflects the time when tables of critical values rather than computer software dominated statistical practice. The 5% level (α = 0.05) is particularly common. There is no sharp border between “significant” and “insignificant,” only increasingly strong evidence as the P-