![]() Big data “Big data” is a vague term, but it is often used by some to emphasize the sheer size of data sets that now exist. Big data are often “found data,” not a random sample. Proponents for big data claim that because every single data point can now be captured, old statistical sampling techniques are obsolete. In essence, they say, we have data on the entire population. Is this true? Many statisticians disagree. They challenge the notion that we could ever have all the data. The claim that we have the entire population is often an assumption, rather than a fact about the data. Although sample sizes are enormous, proponents for big data often ignore the bias that accompanies nonrandom sampling.
Big data “Big data” is a vague term, but it is often used by some to emphasize the sheer size of data sets that now exist. Big data are often “found data,” not a random sample. Proponents for big data claim that because every single data point can now be captured, old statistical sampling techniques are obsolete. In essence, they say, we have data on the entire population. Is this true? Many statisticians disagree. They challenge the notion that we could ever have all the data. The claim that we have the entire population is often an assumption, rather than a fact about the data. Although sample sizes are enormous, proponents for big data often ignore the bias that accompanies nonrandom sampling.
Simple random samples
In a voluntary response sample, people choose whether to respond. In a convenience sample, the interviewer makes the choice. In both cases, personal choice produces bias. The statistician’s remedy is to allow impersonal chance to choose the sample. A sample chosen by chance allows neither favoritism by the sampler nor self-selection by respondents. Choosing a sample by chance attacks bias by giving all individuals an equal chance to be chosen. Rich and poor, young and old, black and white, all have the same chance to be in the sample.
The simplest way to use chance to select a sample is to place names in a hat (the population) and draw out a handful (the sample). This is the idea of simple random sampling.
Simple random sample
A simple random sample (SRS) of size n consists of n individuals from the population chosen in such a way that every set of n individuals has an equal chance to be the sample actually selected.
![]() When is random too random? The streaming music service Spotify received complaints from listeners that the “shuffle” feature, used to play songs in a playlist in a random order, was not random enough. Listeners were hearing the same tracks two or three days in a row or the same artists back to back. The problem was not a lack of randomness, but too much randomness. Spotify developer Mattias Petter Johansson explained that “to humans, truly random does not feel random.”
When is random too random? The streaming music service Spotify received complaints from listeners that the “shuffle” feature, used to play songs in a playlist in a random order, was not random enough. Listeners were hearing the same tracks two or three days in a row or the same artists back to back. The problem was not a lack of randomness, but too much randomness. Spotify developer Mattias Petter Johansson explained that “to humans, truly random does not feel random.”
An SRS not only gives each individual an equal chance to be chosen (thus avoiding bias in the choice), but also gives every possible sample an equal chance to be chosen. Drawing names from a hat does this. Write 100 names on identical slips of paper and mix them in a hat. This is a population. Now draw 10 slips, one after the other. This is an SRS, because any 10 slips have the same chance as any other 10.
NOW IT’S YOUR TURN
Question 2.1
2.1 Sampling my class. There are 20 students in my class. They are listed on my class roster in alphabetical order. There are blank rows between the first five names on the list, the second five names on the list, the third five names on the list, and the last five names on the list. Thus, the list appears as four groups of five names, each separated by blank rows.
I want to take a simple random sample consisting of four of the students in my class. To do this, I select a single student from each group of five as follows. I write the numbers 1 to 5 on identical slips of paper. I mix the slips in a hat and draw one at random. I count this number of students down in the first group of five and select this student. For example, if the number selected is 3, I select the third student in the first group of five on my class roster. I replace the slip in the hat, again mix the slips, and draw a new number. The student this many down on the list in the second group is selected. I repeat this process for the remaining two groups. Every student in the class has a 1-in-5 chance of being selected when I come to his or her group. Thus, every student has the same chance of being selected. Is the sample a simple random sample? Explain.
2.1 This is not a simple random sample. Not every possible group of four students can be selected. For example, four students sitting in the same row can never be selected.
Drawing names from a hat makes clear what it means to give each individual and each possible set of n individuals the same chance to be chosen. That’s the idea of an SRS. Of course, drawing slips from a hat would be a bit awkward for a sample of the country’s 117 million households. In practice, real sample surveys use computer-generated random digits to choose samples. Many statistical software packages have random number generators that generate random digits. Some also allow one to choose an SRS.
EXAMPLE 3 How to choose an SRS using software
Joan’s small accounting firm serves 30 business clients. Joan wants to interview a sample of five clients to find ways to improve client satisfaction. To avoid bias, she chooses an SRS of size 5.
Step 1: Label. Give each client a numerical label between 1 and 30. Here is the list of clients, with labels attached, using 1 to 30:
| 1 | A-1 Plumbing | 16 | JL Appliances |
| 2 | Accent Printing | 17 | Johnson Commodities |
| 3 | Action Sport Shop | 18 | Keiser Construction |
| 4 | Anderson Construction | 19 | Liu’s Chinese Restaurant |
| 5 | Bailey Trucking | 20 | MagicTan |
| 6 | Balloons Inc. | 21 | Peerless Machine |
| 7 | Bennett Hardware | 22 | Photo Arts |
| 8 | Best’s Camera Shop | 23 | River City Antiques |
| 9 | Blue Print Specialties | 24 | Riverside Tavern |
| 10 | Central Tree Service | 25 | Rustic Boutique |
| 11 | Classic Flowers | 26 | Satellite Services |
| 12 | Computer Answers | 27 | Scotch Wash |
| 13 | Darlene’s Dolls | 28 | Sewer’s Center |
| 14 | Fleisch Realty | 29 | Tire Specialties |
| 15 | Hernandez Electronics | 30 | Von’s Video Games |
Step 2: Software. Use statistical software to generate a random integer between 1 and 30. Repeat this process, ignoring any values that were previously generated, until you obtain five different integers between 1 and 30. Joan used software and generated the numbers 18, 9, 10, 3, 9, and 1. The five different integers are 18, 9, 10, 3, and 1, so the sample is the clients Keiser Construction, Blue Print Specialties, Central Tree Service, Action Sport Shop, and A-1 Plumbing.
Generating a random integer with value between 1 and 30 is equivalent to writing the numbers 1 to 30 on identical slips of paper, placing them in a hat, mixing the slips well, and drawing one at random. The computer does the mixing and drawing.
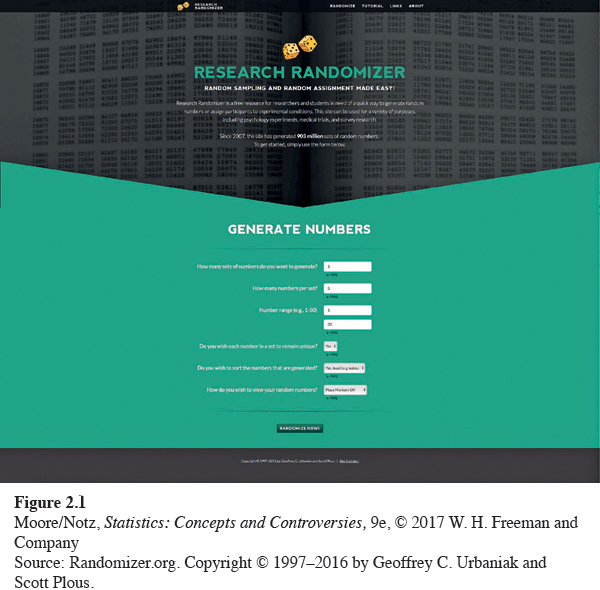
Some statistical software may allow you to generate unique labels. A tool that is available on the Web is the Research Randomizer at www.randomizer.org. Fill in the boxes and click on the Randomize Now button. You can even ask the Randomizer to arrange your sample in order (see Figure 2.1).
If you don’t use software, you can use a table of random digits to choose small samples by hand.
Random digits
A table of random digits is a long string of the digits 0, 1, 2, 3, 4, 5, 6, 7, 8, 9 with these two properties:
1. Each entry in the table is equally likely to be any of the 10 digits 0 through 9.
2. The entries are independent of each other. That is, knowledge of one part of the table gives no information about any other part.
![]() Are these random digits really random? Not a chance. The random digits in Table A were produced by a computer program. Computer programs do exactly what you tell them to do. Give the program the same input, and it will produce exactly the same “random” digits. Of course, clever people have devised computer programs that produce output that looks like random digits. These are called “pseudo-random numbers,” and that’s what Table A contains. Pseudo-random numbers work fine for statistical randomizing, but they have hidden nonrandom patterns that can mess up more refined uses.
Are these random digits really random? Not a chance. The random digits in Table A were produced by a computer program. Computer programs do exactly what you tell them to do. Give the program the same input, and it will produce exactly the same “random” digits. Of course, clever people have devised computer programs that produce output that looks like random digits. These are called “pseudo-random numbers,” and that’s what Table A contains. Pseudo-random numbers work fine for statistical randomizing, but they have hidden nonrandom patterns that can mess up more refined uses.
Table A at the back of the book is a table of random digits. You can think of Table A as the result of asking an assistant (or a computer) to mix the digits 0 to 9 in a hat, draw one, then replace the digit drawn, mix again, draw a second digit, and so on. The assistant’s (or computer’s) mixing and drawing save us the work of mixing and drawing when we need to randomize. Table A begins with the digits 19223950340575628713. To make the table easier to read, the digits appear in groups of five and in numbered rows. The groups and rows have no meaning—the table is just a long list of randomly chosen digits. Here’s how to use the table to choose an SRS.
EXAMPLE 4 How to choose an SRS using a table of random digits
To repeat Example 3, we begin by assigning numerical labels to the 30 clients.
Step 1: Label. Give each client a numerical label, using as few digits as possible. Two digits are needed to label 30 clients, so we use labels
01, 02, 03, . . . , 28, 29, 30
It is also correct to use labels 00 to 29 or even another choice of 30 two-digit labels. Here is the list of clients, with labels attached, using 01 to 30:
| 01 | A-1 Plumbing | 16 | JL Appliances |
| 02 | Accent Printing | 17 | Johnson Commodities |
| 03 | Action Sport Shop | 18 | Keiser Construction |
| 04 | Anderson Construction | 19 | Liu’s Chinese Restaurant |
| 05 | Bailey Trucking | 20 | MagicTan |
| 06 | Balloons Inc. | 21 | Peerless Machine |
| 07 | Bennett Hardware | 22 | Photo Arts |
| 08 | Best’s Camera Shop | 23 | River City Antiques |
| 09 | Blue Print Specialties | 24 | Riverside Tavern |
| 10 | Central Tree Service | 25 | Rustic Boutique |
| 11 | Classic Flowers | 26 | Satellite Services |
| 12 | Computer Answers | 27 | Scotch Wash |
| 13 | Darlene’s Dolls | 28 | Sewer’s Center |
| 14 | Fleisch Realty | 29 | Tire Specialties |
| 15 | Hernandez Electronics | 30 | Von’s Video Games |
Step 2: Table. Enter Table A anywhere and read two-digit groups. Suppose we enter at line 130, which is
| 69051 | 64817 | 87174 | 09517 | 84534 | 06489 | 87201 | 97245 |
The first 10 two-digit groups in this line are
| 69 | 05 | 16 | 48 | 17 | 87 | 17 | 40 | 95 | 17 |
Each two-digit group in Table A is equally likely to be any of the 100 possible groups, 00, 01, 02, . . . , 99. So two-digit groups choose two-digit labels at random. That’s just what we want.
Joan used only labels 01 to 30, so we ignore all other two-digit groups. The first five labels between 01 and 30 that we encounter in the table choose our sample. Of the first 10 labels in line 130, we ignore five because they are too high (over 30). The others are 05, 16, 17, 17, and 17. The clients labeled 05, 16, and 17 go into the sample. Ignore the second and third 17s because that client is already in the sample. Now run your finger across line 130 (and continue to line 131 if needed) until five clients are chosen.
The sample is the clients labeled 05, 16, 17, 20, 19. These are Bailey Trucking, JL Appliances, Johnson Commodities, MagicTan, and Liu’s Chinese Restaurant.
When using a table of random digits, as long as all labels have the same number of digits, all individuals will have the same chance to be chosen. Use the shortest possible labels: one digit for a population of up to 10 members, two digits for 11 to 100 members, three digits for 101 to 1000 members, and so on. As standard practice, we recommend that you begin with label 1 (or 01 or 001, as needed). You can read digits from Table A in any order—across a row, down a column, and so on—because the table has no order. As standard practice, we recommend reading across rows.
Using software or a table of random digits is much quicker than drawing names from a hat. As Examples 3 and 4 show, choosing an SRS has two steps.
Choose an SRS in two steps
Step 1: Label. Assign a numerical label to every individual in the population. Be sure that all labels have the same number of digits if you plan to use a table of random digits.
Step 2: Software or table. Use random digits to select labels at random.
NOW IT’S YOUR TURN
Question 2.2
2.2 Evaluating teaching assistants. To assess how its teaching assistants are performing, the statistics department at a large university randomly selects three of its teaching assistants each week and sends a faculty member to visit their classes. The current list of 20 teaching assistants is given here. Use software, an online tool (for example, the Research Randomizer), or Table A at line 116 to choose three to be visited this week. Remember to begin by labeling the teaching assistants from 01 to 20.
| Alexander | Park |
| Bean | Race |
| Book | Rodgers |
| Burch | Scarborough |
| Gogireddy | Siddiqi |
| Kunkel | Smith |
| Mann | Tang |
| Matthews | Twohy |
| Naqvi | Wilson |
| Ozanne | Zhang |
2.2 Step 1: Label. For the 20 teaching assistants (TAs), we use labels
01, 02, 03, . . . , 18, 19, 20
Specifically, the list of TAs with labels attached is
(01) Alexander (11) Park
(02) Bean (12) Race
(03) Book (13) Rodgers
(04) Burch (14) Scarborough
(05) Gogireddy (15) Siddiqi
(06) Kunkel (16) Smith
(07) Mann (17) Tang
(08) Matthews (18) Twohy
(09) Naqvi (19) Wilson
(10) Ozanne (20) Zhang
Step 2: Software or table. We used the Research Randomizer and requested that it generate one set of numbers with three numbers per set. We specified the number range as 1 to 20. We requested that each number remain unique and that the numbers be sorted least to greatest. We asked to view the outputted numbers with the markers off. After clicking the “Randomize Now!” button, we obtained the digits 1, 5, and 14. (Of course, when you use the Research Randomizer, you will very likely get a different set of three numbers.) The sample is the TAs labeled 01, 05, and 14. These are Alexander, Gogireddy, and Scarborough.
To use the table of random digits, we might enter Table A at line 116 (any line may be used), which is
14459 26056 31424 80371 65103 62253 50490 61181
The first 13 two-digit groups in this line are
14 45 92 60 56 31 42 48 03 71 65 10 36
We used only labels 01 to 20, so we ignore all other two-digit groups. The first 3 labels between 01 and 20 that we encounter in the table choose our sample. Of the first 13 labels in line 116, we ignore 10 of them because they are too high (over 20). The others are 14, 03, and 10. The sample is the TAs labeled 03, 10, and 14. These are Book, Ozanne, and Scarborough.