CHAPTER 3 EXERCISES
Question 3.8
 3.8 Unemployment. The boldface number in the next paragraph is the value of either a parameter or a statistic. State which it is.
The Bureau of Labor Statistics announces that last month it interviewed all members of the labor force in a sample of 60,000 households; 5.4% of the people interviewed were unemployed.
Question 3.9
3.9 Ball bearing acceptance. Each boldface number in the next paragraph is the value of either a parameter or a statistic. In each case, state which it is.
A carload lot of ball bearings has an average diameter of 2.503 centimeters (cm). This is within the specifications for acceptance of the lot by the purchaser. The inspector happens to inspect 100 bearings from the lot with an average diameter of 2.515 cm. This is outside the specified limits, so the lot is mistakenly rejected.
3.9 2.503 cm is a parameter because the value represents the entire population; 2.515 cm is a statistic because the value represents the sample.
Question 3.10
3.10 Registered Republicans. Each boldface number in the next paragraph is the value of either a parameter or a statistic. In each case, state which it is.
Voter registration records show that 25% of all voters in the United States are registered as Republicans. However, a national radio talk show host found that of 20 Americans who called the show recently, 60% were registered Republicans.
Question 3.11
3.11 Wireless telephones. Each boldface number in the next paragraph is the value of either a parameter or a statistic. In each case, state which it is.
The Behavioral Risk Factor Surveillance System (BRFSS) telephone survey is conducted annually in the United States. Of the first 100 numbers dialed, 55 numbers were for wireless telephones. This is not surprising, because, as of the first half of 2014, 52.1% of all U.S. children lived in households that were wireless only.
3.11 55 is a statistic because the value represents the sample; 52.1% is a parameter because the value represents the population.
Question 3.12
3.12 A sampling experiment. Figures 3.1 and 3.2 show how the sample proportion ˆp behaves when we take many samples from the same population. You can follow the steps in this process on a small scale.
Figure 3.4 represents a small population. Each circle represents an adult. The white circles are people who favor a constitutional amendment that would define marriage as being between a man and a woman, and the colored circles are people who are opposed. You can check that 50 of the 100 circles are white, so in this population the proportion who favor an amendment is p = 50/100 = 0.5.
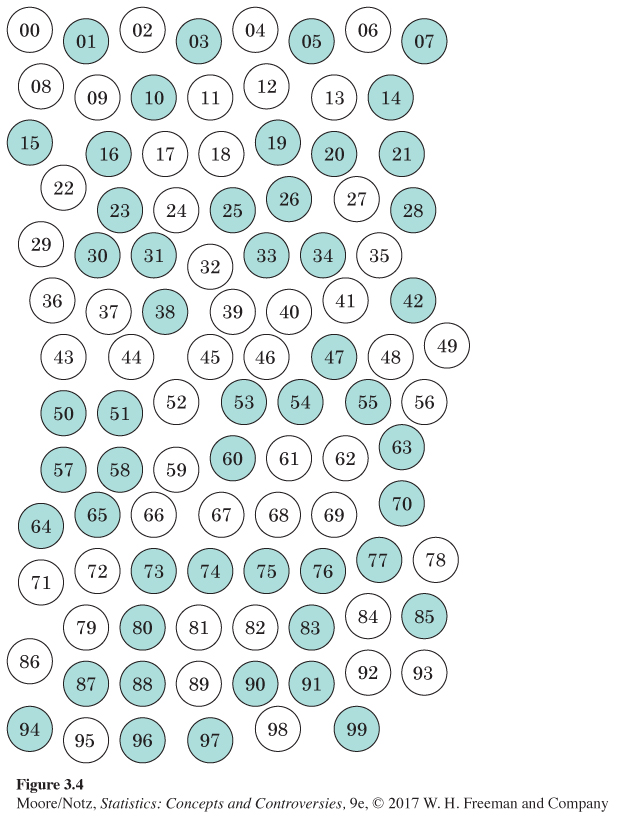
(a) The circles are labeled 00, 01, . . . , 99. Use line 101 of Table A to draw an SRS of size 4. What is the proportion ˆp of the people in your sample who favor a constitutional amendment?
Page 56(b) Take nine more SRSs of size 4 (10 in all), using lines 102 to 110 of Table A, a different line for each sample. You now have 10 values of the sample proportion ˆp. Write down the 10 values you should now have of the sample proportion ˆp.
(c) Because your samples have only four people, the only values ˆp can take are 0/4, 1/4, 2/4, 3/4, and 4/4. That is, ˆp is always 0, 0.25, 0.5, 0.75, or 1. Mark these numbers on a line and make a histogram of your 10 results by putting a bar above each number to show how many samples had that outcome.
(d) Taking samples of size 4 from a population of size 100 is not a practical setting, but let’s look at your results anyway. How many of your 10 samples estimated the population proportion p = 0.5 exactly correctly? Is the true value 0.5 in the center of your sample values? Explain why 0.5 would be in the center of the sample values if you took a large number of samples.
Question 3.13
3.13 A sampling experiment. Let us illustrate sampling variability in a small sample from a small population. Ten of the 25 club members listed here are female. Their names are marked with asterisks in the list. The club chooses five members at random to receive free trips to the national convention.
| Alonso | Darwin |
| Binet* | Epstein |
| Blumenbach | Ferri |
| Chase* | Gonzales* |
| Chen* | Gupta |
| Herrnstein | Thomson |
| Jimenez* | Toulmin |
| Luo | Vogt* |
| Moll* | Went |
| Morales* | Wilson |
| Myrdal | Yerkes |
| Perez* | Zimmer |
| Spencer* |
(a) Use the Simple Random Sample applet, other software, or a different part of Table A to draw 20 SRSs of size 5. Record the number of females in each of your samples. Make a histogram like that in Figure 3.1 to display your results. What is the average number of females in your 20 samples?
(b) Do you think the club members should suspect discrimination if none of the five tickets go to women?
3.13 (a) Results will vary. (b) The theoretical probability of choosing no females in this scenario is approximately 5%. We would expect only about 1 in 20 samples to have no women in them. Thus, it is not impossible to choose no females, but it is unlikely, so this may be enough reason to suspect discrimination.
Question 3.14
3.14 Another sampling experiment. Let us illustrate sampling variability in a small sample from a small population. Seven of the 20 college softball players listed here are in-state students. Their names are marked with asterisks in the list. The coach chooses five players at random to receive a new scholarship funded by alumni.
| Betsa | Richvalsky* |
| Blanco | Romero |
| Christner | Sbonek* |
| Connell | Susalla* |
| Driesenga* | Swearingen |
| Falk | Sweet |
| Garfinkel* | Swift* |
| Lawrence | Vargas |
| Montemarano | Wagner |
| Ramirez | Wald* |
(a) Use the Simple Random Sample applet, other software, or a different part of Table A to draw 20 SRSs of size 5. Record the number of in-state students in each of your samples. Make a histogram like that in Figure 3.1 to display your results. What is the average number of in-state players in your 20 samples?
(b) Do you think the college should suspect discrimination if none of the five scholarships go to in-state players?
Question 3.15
3.15 Canada’s national health care. The Ministry of Health in the Canadian province of Ontario wants to know whether the national health care system is achieving its goals in the province. Much information about health care comes from patient records, but that source doesn’t allow us to compare people who use health services with those who don’t. So the Ministry of Health conducted the Ontario Health Survey, which interviewed a random sample of 61,239 people who live in the province of Ontario.
(a) What is the population for this sample survey? What is the sample?
(b) The survey found that 76% of males and 86% of females in the sample had visited a general practitioner at least once in the past year. Do you think these estimates are close to the truth about the entire population? Why?
3.15 (a) Population: Ontario residents. Sample: 61,239 Ontario residents interviewed. (b) These estimates are likely close to the truth about the entire population because the sample was large and random.
Question 3.16
3.16 Environmental problems. A Gallup Poll found that Americans, when asked about a list of environmental problems, were increasingly worried about problems such as pollution of drinking water, soil, air, and waterways, but were least worried about climate change or global warming. Gallup’s report said, “Results for this Gallup poll are based on telephone interviews conducted March 5–8, 2015, with a random sample of 1,025 adults, aged 18 and older, living in all 50 U.S. states and the District of Columbia.”
(a) What is the population for this sample survey? What is the sample?
(b) The survey found that 64% of Republicans and those who lean Republican and 76% of Democrats and those who lean Democratic in the sample are most concerned about pollution of drinking water. Do you think these estimates are close to the truth about the entire population? Why?
Question 3.17
3.17 Bigger samples, please. Explain in your own words the advantages of bigger random samples in a sample survey.
3.17 The larger sample will give less variable results. Thus, large samples are more likely to yield results close to the true value in the population as long as the bias is small.
Question 3.18
3.18 Sampling variability. In thinking about Gallup’s sample of size 1015, we asked, “Could it happen that one random sample finds that 54% of adults feel that childhood vaccination is extremely important and a second random sample finds that only 42% favor one?” Look at Figure 3.2, which shows the results of 1000 samples of this size when the population truth is p = 0.5, or 50%. Would you be surprised if a sample from this population gave 54%? Would you be surprised if a sample gave 42%? Use Figure 3.2 to support your reasoning.
Question 3.19
3.19 Health care satisfaction. A November 2014 Gallup Poll of 828 adults found that 472 are satisfied with the total cost they pay for their health care. The announced margin of error is ±4 percentage points. The announced confidence level is 95%.
(a) What is the value of the sample proportion ˆp who say they are satisfied with the total cost they pay for their health care? Explain in words what the population parameter p is in this setting.
(b) Make a confidence statement about the parameter p.
3.19 (a) The value of the statistic is 57%. The parameter p in the setting is the true proportion of all American adults who are satisfied with the total cost they pay for their health care. (b) We are 95% confident the percent of all American adults who are satisfied with the total cost they pay for their health care is between 53% and 61%.
Question 3.20
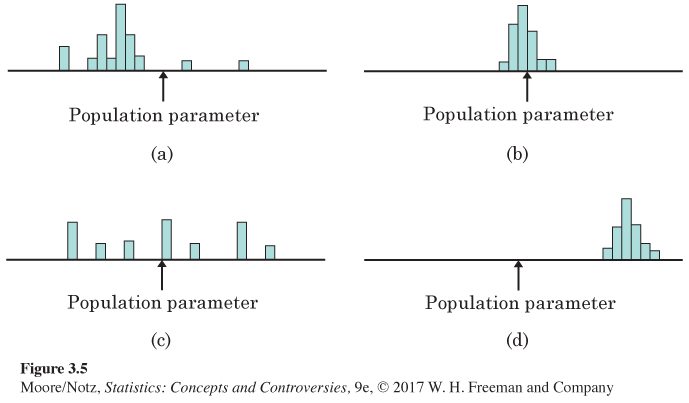
3.20 Bias and variability. Figure 3.5 shows the behavior of a sample statistic in many samples in four situations. These graphs are like those in Figures 3.1 and 3.2. That is, the heights of the bars show how often the sample statistic took various values in many samples from the same population. The true value of the population parameter is marked on each graph. Label each of the graphs in Figure 3.5 as showing high or low bias and as showing high or low variability.
Question 3.21
3.21 Is a larger sample size always better? In February 2004, USA Today conducted an online poll. Visitors to its website were asked the following question: “Should the U.S. pass a constitutional amendment banning gay marriage?” Visitors could vote by clicking a button. The results as of 3:30 P.M. on February 25 were that 68.61% voted No and 31.39% voted Yes. A total of 63,046 votes had been recorded. Using our quick method, we find that the margin of error for 95% confidence for a sample of this size is roughly equal to four-tenths of 1 percentage point. Is it correct to say that, based on this USA Today online poll, we are 95% confident that 68.61% ±0.4% of American adults are opposed to having the United States pass a constitutional amendment banning gay marriage? Explain your answer. Be careful not to confuse your personal opinion with the statistical issues.
3.21 No. This is not correct. It would be correct if the results of this survey had come from a random sample of American adults, but because this is a voluntary response sample, it is likely to be biased.
Question 3.22
3.22 Predict the election. Just before a presidential election, a national opinion poll increases the size of its weekly sample from the usual 1000 people to 4000 people. Does the larger random sample reduce the bias of the poll result? Does it reduce the variability of the result?
Question 3.23
3.23 Take a bigger sample. A management student is planning a project on student attitudes toward part-time work while attending college. She develops a questionnaire and plans to ask 25 randomly selected students to fill it out. Her faculty adviser approves the questionnaire but suggests that the sample size be increased to at least 100 students. Why is the larger sample helpful? Back up your statement by using the quick and approximate method to estimate the margin of error for samples of size 25 and for samples of size 100.
3.23 The larger sample will yield less variable results and a smaller margin of error. According to the quick method, the margin of error for the sample of size 25 will be twice as big as the margin of error for the sample of size 100 (1/5 = 0.2 vs. 1/10 = 0.1).
Question 3.24
3.24 Sampling in the states. An agency of the federal government plans to take an SRS of residents in each state to estimate the proportion of owners of real estate in each state’s population. The populations of the states range from about 563,600 people in Wyoming to about 37.3 million in California, according to the 2010 U.S. census.
(a) Will the variability of the sample proportion change from state to state if an SRS of size 2000 is taken in each state? Explain your answer.
(b) Will the variability of the sample proportion change from state to state if an SRS of 1/10 of 1% (0.001) of the state’s population is taken in each state? Explain your answer.
Question 3.25
3.25 Polling women. A New York Times Poll on women’s issues interviewed 1025 women randomly selected from the United States, excluding Alaska and Hawaii. The poll found that 47% of the women said they do not get enough time for themselves.
(a) The poll announced a margin of error of ±3 percentage points for 95% confidence in its conclusions. Make a 95% confidence statement about the percentage of all adult women who think they do not get enough time for themselves.
(b) Explain to someone who knows no statistics why we can’t just say that 47% of all adult women do not get enough time for themselves.
(c) Then explain clearly what “95% confidence” means.
3.25 (a) We are 95% confident the percent of all adult women who think they do not get enough time for themselves is between 44% and 50%. (b) We only have information from a sample, not from all adult women. While our sample results are likely to be close to the true value in the population, we cannot assume that they will be exactly the same. (c) The interval 44% to 50% is based on a procedure that gives correct results (that is, includes the true value in the population) 95% of the time.
Question 3.26
3.26 Polling men and women. The sample survey described in Exercise 3.25 interviewed 472 randomly selected men as well as 1025 women. The poll announced a margin of error of ±3 percentage points for 95% confidence in conclusions about women. The margin of error for results concerning men was ±5 percentage points. Why is this larger than the margin of error for women?
Question 3.27
3.27 Explaining confidence. A student reads that we are 95% confident that the average score of eighth-grade girls on the writing part of the 2011 National Assessment of Educational Progress is 163.8 to 165.2. Asked to explain the meaning of this statement, the student says, “95% of all eighth-grade girls have writing scores between 163.8 and 165.2.” Is the student right? Explain your answer.
3.27 The student is incorrect. The correct interpretation is that we are 95% confident that the average NAEP score of all eighth-grade girls on the writing part is between 163.8 and 165.2.
Question 3.28
3.28 The death penalty. In October 2014, the Gallup Poll asked a sample of 1017 adults, “Are you in favor of the death penalty for a person convicted of murder?” The proportion who said they were in favor was 63%.
(a) Approximately how many of the 1017 people interviewed said they were in favor of the death penalty for a person convicted of murder?
(b) Gallup says that the margin of error for this poll is ±4 percentage points. Explain to someone who knows no statistics what “margin of error ±4 percentage points” means.
Question 3.29
3.29 Find the margin of error. Example 6 tells us that a SurveyUSA poll asked 595 likely voters in Georgia which presidential candidate they would vote for; 52% said they would vote for Mitt Romney. Use the quick method to estimate the margin of error for conclusions about all likely voters in Georgia. How does your result compare with SurveyUSA’s margin of error given in Example 6?
3.29 The estimated margin of error is 4.1%. This is essentially the same as the 4.1% margin of error given in Example 6.
Question 3.30
3.30 Find the margin of error. Exercise 3.28 concerns a Gallup Poll sample of 1017 people. Use the quick and approximate method to estimate the margin of error for statements about the population of all adults. Is your result close to the ±4% margin of error announced by Gallup?
Question 3.31
3.31 Find the margin of error. Exercise 3.15 describes a sample survey of 61,239 adults living in Ontario. Estimate the margin of error for conclusions having 95% confidence about the entire adult population of Ontario.
3.31 The estimated margin of error is 0.4%.
Question 3.32
3.32 Belief in God. A Gallup Poll conducted in May 2011 reports that 92% of a sample of 509 adults said Yes when asked “Do you believe in God?”
(a) Use the quick method to estimate the margin of error for an SRS of this size.
(b) Assuming that this was a random sample, make a confidence statement about the percentage of all adults who believe in God.
Question 3.33
3.33 Abortion. A 2014 Gallup Poll of 1028 adults found that 216 thought abortion should be illegal in all circumstances, a decrease of 2 percentage points from the record high in 2009. Make a confidence statement about the percentage of all adults who thought abortion should be illegal in all circumstances, at the time the poll was taken. (Assume that this is an SRS, and use the quick and approximate method to find the margin of error.)
3.33 We are 95% confident that the percent of all adults who think abortion should be illegal in all circumstances is between 18% and 24%.
Question 3.34
3.34 Moral uncertainty versus statistical uncertainty. In Exercise 3.33 and in the Case Study, we examined polls involving controversial issues, either from a moral or personal liberty perspective (we will call this “moral uncertainty”). In both polls, national opinion was divided, suggesting that there is considerable moral uncertainty regarding both issues. What was the margin of error (the “statistical uncertainty”) in both polls? Is it possible for issues with a high degree of moral uncertainty to have very little statistical uncertainty? Discuss.
Question 3.35
3.35 Smaller margin of error. Exercise 3.28 describes an opinion poll that interviewed 1017 people. Suppose that you want a margin of error half as large as the one you found in that exercise. How many people must you plan to interview?
3.35 To reduce the margin of error to half its size, we need to quadruple the sample size. Thus, the sample size would need to be 4068.
Question 3.36
3.36 Satisfying Congress. Exercise 3.19 describes a sample survey of 828 adults, with margin of error ±4% for 95% confidence.
(a) A member of Congress thinks that 95% confidence is not enough. He wants to be 99% confident. How would the margin of error for 99% confidence based on the same sample compare with the margin of error for 95% confidence?
(b) Another member of Congress is satisfied with 95% confidence, but she wants a smaller margin of error than ±4 percentage points. How can we get a smaller margin of error, still with 95% confidence?
Question 3.37
3.37 The Current Population Survey. Though opinion polls usually make 95% confidence statements, some sample surveys use other confidence levels. The monthly unemployment rate, for example, is based on the Current Population Survey of about 60,000 households. The margin of error in the unemployment rate is announced as about two-tenths of 1 percentage point with 90% confidence. Would the margin of error for 95% confidence be smaller or larger? Why?
3.37 To be more confident that the randomly varying sample statistic will land within a given margin of error of the true population parameter, we must allow a larger margin of error. So the margin of error for 95% confidence is larger than for 90% confidence.
Question 3.38
3.38 Honesty and Wall Street? In May 2012, the Harris Poll asked a random sample of 1016 adults if they agreed with the following statement: “Most people on Wall Street would be willing to break the law if they believed they could make a lot of money and get away with it.” It found that 711 agreed with the statement. Write a short report of this finding, as if you were writing for a newspaper. Be sure to include a margin of error. Be careful not to confuse your personal opinion with the statistical findings.
Question 3.39
3.39 Who is to blame? A February 2009 poll conducted by the Marist College Institute for Public Opinion in Poughkeepsie, New York, asked a random sample of 2071 U.S. adults who or what was responsible for a company’s failure or success. Of those surveyed, 70% attributed a company’s failure or success to the decisions of its top executives. The poll asked the same question of a random sample of 110 business executives. Among executives, 88% said that top executives were responsible for a company’s success or failure.
Marist reported that the margin of error for one of these results was ±9 percentage points and for the other it was ±2.5 percentage points. Which result had the margin of error of ±9 percentage points? Explain your answer.
3.39 The margin of error of ±9% belongs to the poll of business executives because there was a smaller sample of business executives selected.
Question 3.40
3.40 Simulation. Random digits can be used to simulate the results of random sampling. Suppose that you are drawing simple random samples of size 25 from a large number of college students and that 20% of the students are unemployed during the summer. To simulate this SRS, generate 25 random digits using the Simple Random Sample applet or let 25 consecutive digits in Table A stand for the 25 students in your sample. The digits 0 and 1 stand for unemployed students, and other digits stand for employed students. This is an accurate imitation of the SRS because 0 and 1 make up 20% of the 10 equally likely digits.
Simulate the results of 50 samples by counting the number of 0s and 1s in the first 25 entries in each of the 50 repetitions of the Simple Random Sample applet or in each of the 50 rows of Table A. Make a histogram like that in Figure 3.1 to display the results of your 50 samples. Is the truth about the population (20% unemployed, or 5 in a sample of 25) near the center of your graph? What are the smallest and largest counts of unemployed students that you obtained in your 50 samples? What percentage of your samples had either four, five, or six unemployed?

EXPLORING THE WEB
Follow the QR code to access exercises.