Nonsampling errors
Nonsampling errors are those that can plague even a census. They include processing errors—mistakes in mechanical tasks such as doing arithmetic or entering responses into a computer. Fortunately, the wide availability and adoption of computers has made processing errors less common than in the past.
EXAMPLE 2 Computer-assisted interviewing
The days of the interviewer with a clipboard are past. Contemporary interviewers carry a laptop computer for face-to-face interviews or watch a computer screen as they carry out a telephone interview. Computer software manages the interview. The interviewer reads questions from the computer screen and uses the keyboard to enter the responses. The computer skips irrelevant items—once a respondent says that she has no children, further questions about her children never appear. The computer can check that answers to related questions are consistent with each other. It can even present questions in random order to avoid any bias due to always asking questions in the same order.
Computer software also manages the record keeping. It keeps records of who has responded and prepares a file of data from the responses. The tedious process of transferring responses from paper to computer, once a source of processing errors, has disappeared. The computer even schedules the calls in telephone surveys, taking account of the respondent’s time zone and honoring appointments made by people who were willing to respond but did not have time when first called.
Another type of nonsampling error is response error, which occurs when a subject gives an incorrect response. A subject may lie about her age or income or about whether she has used illegal drugs. She may remember incorrectly when asked how many packs of cigarettes she smoked last week. A subject who does not understand a question may guess at an answer rather than appear ignorant. Questions that ask subjects about their behavior during a fixed time period are notoriously prone to response errors due to faulty memory. For example, the National Health Survey asks people how many times they have visited a doctor in the past year. Checking their responses against health records found that they failed to remember 60% of their visits to a doctor. A survey that asks about sensitive issues can also expect response errors, as the next example illustrates.
EXAMPLE 3 The effect of race
In 1989, New York City elected its first black mayor and the state of Virginia elected its first black governor. In both cases, samples of voters interviewed as they left their polling places predicted larger margins of victory than the official vote counts. The polling organizations were certain that some voters lied when interviewed because they felt uncomfortable admitting that they had voted against the black candidate. This phenomenon is known as “social desirability bias” and “the Bradley effect,” after Tom Bradley, the former black mayor of Los Angeles who lost the 1982 California gubernatorial election despite leading in final-day preelection polls.
This effect attracted media attention during the 2008 presidential election. A few weeks before the election, polls predicted a victory, possibly a big one, for Barack Obama. Even so, Democrats worried that these polls might be overly optimistic because of the Bradley effect. In this case their fears were unfounded, but some political scientists claimed to detect the Bradley effect in polls predicting outcomes in primary races between Barack Obama and Hilary Clinton (for example, in the New Hampshire primary, polls predicted an 8 percentage point Obama victory, but Clinton won by 3 percentage points).
Technology and attention to detail can minimize processing errors. Skilled interviewers greatly reduce response errors, especially in face-to-face interviews. There is no simple cure, however, for the most serious kind of nonsampling error, nonresponse.
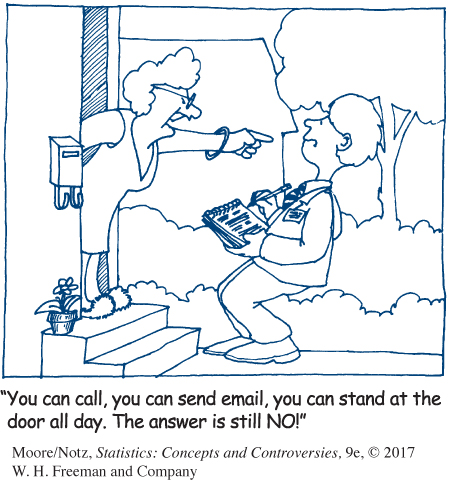
Nonresponse
Nonresponse is the failure to obtain data from an individual selected for a sample. Most nonresponse happens because some subjects can’t be contacted or because some subjects who are contacted refuse to cooperate.
Nonresponse is the most serious problem facing sample surveys. People are increasingly reluctant to answer questions, particularly over the phone. The rise of telemarketing, voicemail, and caller ID drives down response to telephone surveys. Gated communities and buildings guarded by doormen prevent face-to-face interviews. Nonresponse can bias sample survey results because different groups have different rates of nonresponse. Refusals are higher in large cities and among the elderly, for example. Bias due to nonresponse can easily overwhelm the random sampling error described by a survey’s margin of error.
EXAMPLE 4 How bad is nonresponse?
The U.S. Census Bureau’s American Community Survey (ACS) is a monthly survey of almost 300,000 housing units and replaced the U.S. Census Bureau’s “long form” that, in the past, was sent to some households in the every-10-years national census. Participation in the ACS is mandatory, and the U.S. Census Bureau follows up by telephone and then in person if a household fails to return the mail questionnaire.
The ACS has the lowest nonresponse rate of any poll we know: in 2013, only about 1.3% of the households in the sample refused to respond; the overall nonresponse rate, including “never at home” and other causes, was 10.1%. This is a stark contrast in nonresponse from previous years—in 2012, the total nonresponse rate was only 2.7%. In October 2013, there was a government shutdown. During that time, “the ACS did not have a second mailing, a telephone followup, or a person followup operation for the October 2013 housing unit panel. . . . This caused a drop in the annual housing unit response rate of about 7 percentage points.” If October 2013 is excluded from the ACS when considering nonresponse, the total nonresponse rate for 2013 was only 2.9%, similar to previous years.
Another survey that has a remarkable response rate is the University of Chicago’s General Social Survey (GSS), the nation’s most important social survey. The GSS (Example 7 in Chapter 1) contacts its sample in person, and it is run by a university. Despite these advantages, its recent surveys have a 30% rate of nonresponse.
What about polls done by the media and by market research and opinion-polling firms? We often don’t know their rates of nonresponse because they won’t say. That itself is a bad sign. The Pew poll we looked at in the Case Study suggests how bad things are. Pew got 1221 responses (of whom 1000 were in the population they targeted) and 1658 who were never at home, refused, or would not finish the interview. That’s a nonresponse rate of 1658 out of 2879, or 58%. The Pew researchers were more thorough than many pollsters. Insiders say that nonresponse often reaches 75% or 80% of an opinion poll’s original sample.
The situation investigated in the Case Study was more promising than a recent Pew survey. In a December 2013 survey on social media use, the Pew Research Center provided a full disposition of the sampled phone numbers. Here are the details. Initially, 40,985 landline and 27,000 cell phones were dialed, with 11,260 of the landlines and 15,758 of the cell numbers being working numbers. Of these 27,018 working numbers, they were able to contact 17,335, or about 64%, as a large portion of the calls went to voicemail. Among those contacted, about 15% cooperated. Of those cooperating, some numbers were ineligible due to language barriers or contacting a child’s cell phone, and some calls were eventually broken off without being completed. To sum it up, the 27,018 working numbers dialed resulted in a final sample of 1801, giving a response rate of about 7%, an estimate of the fraction of all eligible respondents in the sample who were ultimately interviewed.
Sample surveyors know some tricks to reduce nonresponse. Carefully trained interviewers can keep people on the line if they answer at all. Calling back over longer time periods helps. So do letters sent in advance. Letters and many callbacks slow down the survey, so opinion polls that want fast answers to satisfy the media don’t use them. Even the most careful surveys find that nonresponse is a problem that no amount of expertise can fully overcome. That makes this reminder even more important:
What the margin of error doesn’t say
The announced margin of error for a sample survey covers only random sampling error. Undercoverage, nonresponse, and other practical difficulties can cause large bias that is not covered by the margin of error.
Careful sample surveys warn us about the other kinds of error. The Pew Research Center, for example, says, “In addition to sampling error, one should bear in mind that question wording and practical difficulties in conducting surveys can introduce error or bias into the findings of opinion polls.” How true it is.
![]() He started it! A study of deaths in bar fights showed that in 90% of the cases, the person who died started the fight. You shouldn’t believe this. If you killed someone in a fight, what would you say when the police ask you who started the fight? After all, dead men tell no tales. Now that’s nonresponse.
He started it! A study of deaths in bar fights showed that in 90% of the cases, the person who died started the fight. You shouldn’t believe this. If you killed someone in a fight, what would you say when the police ask you who started the fight? After all, dead men tell no tales. Now that’s nonresponse.
Does nonresponse make many sample surveys useless? Maybe not. We began this chapter with an account of a “standard” telephone survey done by the Pew Research Center. The Pew researchers also carried out a “rigorous” survey, with letters sent in advance, unlimited calls over eight weeks, letters by priority mail to people who refused, and so on. All this drove the rate of nonresponse down to 30%, compared with 58% for the standard survey. Pew then compared the answers to the same questions from the two surveys. The two samples were quite similar in age, sex, and race, though the rigorous sample was a bit more prosperous. The two samples also held similar opinions on all issues except one: race. People who at first refused to respond were less sympathetic toward the plights of blacks and other minorities than those who were willing to respond when contacted the first time. Overall, it appears that standard polls give reasonably accurate results. But, as in Example 3, race is again an exception.