PART IV REVIEW
PART IV REVIEW
Statistical inference draws conclusions about a population on the basis of sample data and uses probability to indicate how reliable the conclusions are. A confidence interval estimates the true value of an unknown parameter. A significance test shows how strong the evidence is for some claim about a parameter. Chapters 21 and 22 present the reasoning of confidence intervals and tests and give optional details for inference about population proportions p and population means μ.
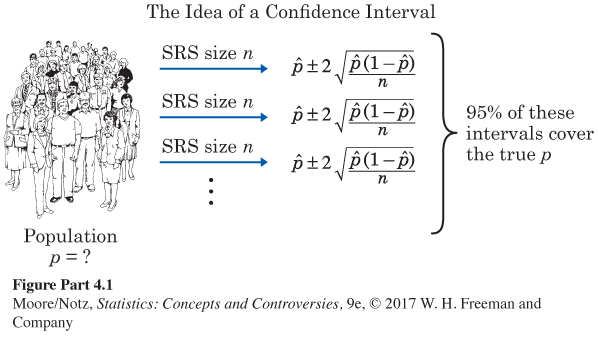
The probabilities in both confidence intervals and significance tests tell us what would happen if we were to use the formula for the interval or test very many times. A confidence level is the probability that the formula for a confidence interval actually produces an interval that contains the unknown parameter. A 95% confidence interval gives a correct result 95% of the time when we use it repeatedly. Figure IV.1 illustrates the reasoning using the 95% confidence interval for a population proportion p.
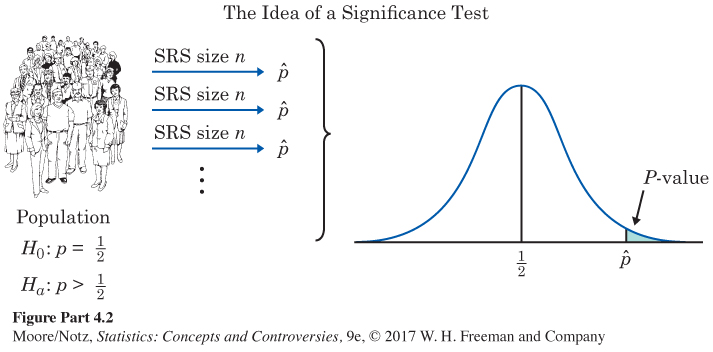
A P-value is the probability that the test would produce a result at least as extreme as the observed result if the null hypothesis really were true. Figure IV.2 illustrates the reasoning, placing the sample proportion ˆp from our one sample on the Normal curve that shows how ˆp would vary in all possible samples if the null hypothesis were true. A P-value tells us how surprising the observed outcome is. Very surprising outcomes (small P-values) are good evidence that the null hypothesis is not true.


To detect sound and unsound uses of inference, you must know the basic reasoning and also be aware of some fine points and pitfalls. Chapter 23 will help. The optional sections in Chapters 21 and 22 and the optional Chapter 24 discuss a few more specific inference procedures. Chapter 24 deals with two-