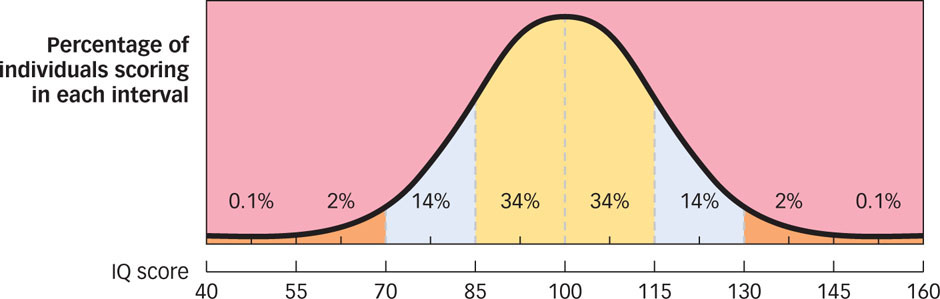
Figure 10.9:
The Normal Curve of Intelligence
Deviation IQ scores produce a normal curve. This graph shows the percentage of people who score in each range of IQ.
[
Leave
] [
Close
]
Next