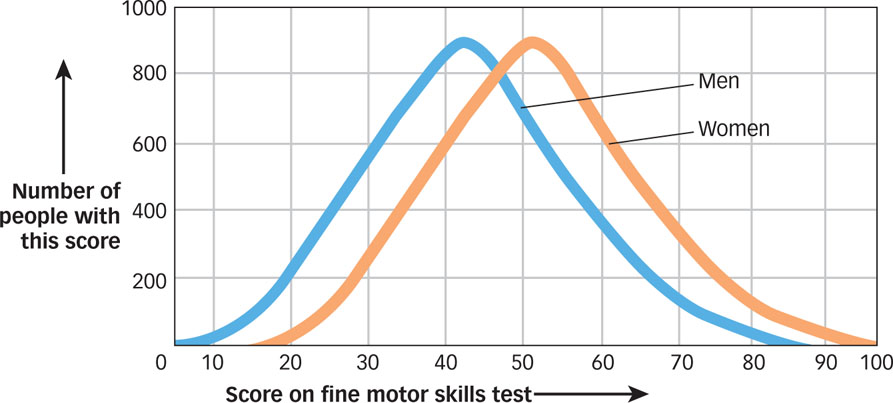
Figure 2.2: Frequency Distributions This graph shows how a hypothetical group of men and women scored on a test of fine motor skills. Test scores are listed along the horizontal axis, and the frequency with which each score was obtained is represented along the vertical axis.