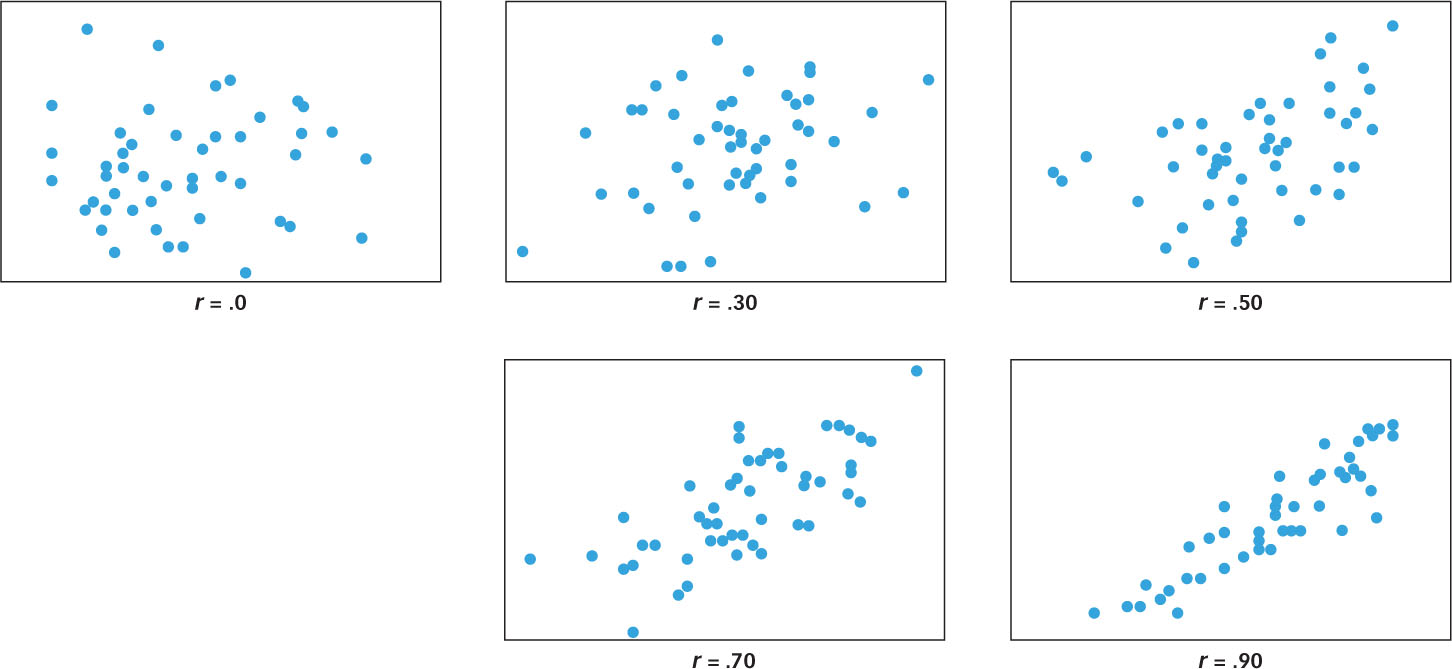
Figure 2.8: Positive Correlations of Different Strengths These graphs illustrate different degrees of positive correlation between two variables. When there are few exceptions to the rule X = Y, then the correlation is strong and r is closer to 1. When there are many exceptions to this rule, the correlation is weak and r is closer to 0.