2.2 Observation: Discovering What People Do
To observe means to use one’s senses to learn about the properties of an event (e.g., a storm or a parade) or an object (e.g., an apple or a person). For example, when you observe a round, red apple, your brain is using the pattern of light that is coming into on your eyes to draw an inference about the apple’s identity, shape, and colour. That kind of informal observation is fine for buying fruit but not for doing science. Why? First, casual observations are notoriously unstable. The same apple may appear red in the daylight and crimson at night or spherical to one person and elliptical to another. Second, casual observations cannot tell us about all of the properties that might interest us. No matter how long and hard you look, you will never be able to discern an apple’s crunchiness or pectin content simply by watching it.
Luckily, scientists have devised techniques that allow them to overcome these problems. In the first section (Measurement), we will see how psychologists design instruments and then use them to make measurements. In the second section (Descriptions), we will see what psychologists do with their measurements once they have made them.
2.2.1 Measurement
What two things does measurement require?
For most of human history, people had no idea how old they were because there was no simple way to keep track of time—
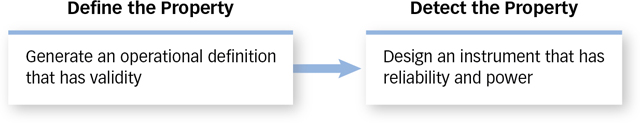
2.2.1.1 Defining and Detecting
The last time you said, “just give me a second,” you probably did not know you were talking about atomic decay. Every unit of time has an operational definition, which is a description of a property in concrete, measurable terms. The operational definition of a second is the duration of 9 192 631 770 cycles of microwave light absorbed or emitted by the hyperfine transition of cesium-
The steps we take to measure a physical property are the same steps we take to measure a psychological property. For example, if we wanted to measure a person’s intelligence, or shyness, or happiness, we would have to start by generating an operational definition of that property—
2.2.1.2 Validity, Reliability, and Power
What are the properties of a good operational definition and a good instrument?
There are many ways to define and detect a property such as happiness, so which ways are best? The most important feature of an operational definition is validity, the goodness with which a concrete event defines a property. For example, the concrete event called frequency of smiling is a valid way to define the property called happiness because, as we all know, people tend to smile more often when they feel happy. Do they eat more or talk more or spend more money? Well, maybe. But maybe not. And that is why food consumption or verbal output or financial expenditures would probably be regarded by most people as invalid measures of happiness (though perfectly valid measures of something else). Validity is to some extent in the eye of the beholder, but most beholders would agree that the frequency of smiles is a more valid way to operationally define happiness than is frequency of eating, talking, or spending.
What then is the most important feature of an instrument? Actually, there are two. First, a good instrument has reliability, which is the tendency for an instrument to produce the same measurement whenever it is used to measure the same thing. For example, if a person smiles just as much on Tuesday as on Wednesday, then a smile-
2.2.1.3 Demand Characteristics
How do people respond when they know they are being observed?
Once we have a valid definition and a reliable and powerful instrument, are we finally ready to measure behaviour? Yes, as long as we want to measure the behaviour of an amoeba or a raindrop or anything else that does not care if we are watching it. But if we want to measure the behaviour of a human being, then we still have some work to do, because while we are trying to discover how people normally behave, normal people will be trying to behave as they think we want or expect them to. Demand characteristics are those aspects of an observational setting that cause people to behave as they think someone else wants or expects. We call these demand characteristics because they seem to “demand” or require that people say and do certain things. When someone you love asks, “Do these jeans make me look fat?” the right answer is always no, and if you have ever been asked this question, then you have experienced demand. Demand characteristics make it hard to measure behaviour as it typically unfolds.
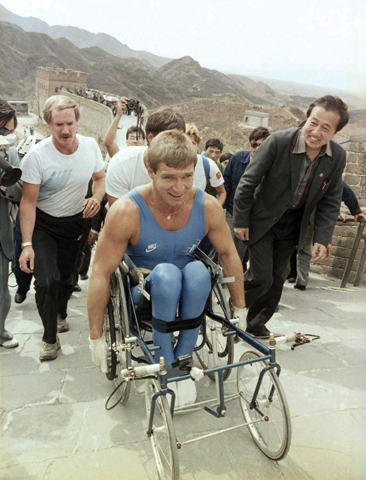
One way that psychologists avoid the problem of demand characteristics is by observing people without their knowledge. Naturalistic observation is a technique for gathering scientific information by unobtrusively observing people in their natural environments. For example, naturalistic observation has shown that the biggest groups leave the smallest tips in restaurants (Freeman et al., 1975), that hungry shoppers buy the most impulse items at the grocery store (Gilbert, Gill, & Wilson, 2002), that golfers are most likely to cheat when they play several opponents at once (Erffmeyer, 1984), that men do not usually approach the most beautiful woman at a singles’ bar (Glenwick, Jason, & Elman, 1978), and that Olympic athletes smile more when they win the bronze medal than the silver medal (Medvec, Madey, & Gilovich, 1995). Each of these conclusions is the result of measurements made by psychologists who observed people who did not know they were being observed. It seems unlikely that the same observations could have been made if the diners, shoppers, golfers, singles, and athletes had realized that they were being scrutinized.
Unfortunately, naturalistic observation is not always a viable solution to the problem of demand characteristics. First, some of the things psychologists want to observe simply do not occur naturally. If we wanted to know whether people who have undergone sensory deprivation perform poorly on motor tasks, we would have to hang around the shopping mall for a very long time before a few dozen blindfolded people with earplugs just happened to wander by and start typing. Second, some of the things that psychologists want to observe can only be gathered from direct interaction with a person, for example, by administering a survey, giving tests, conducting an interview, or hooking someone up to a machine. If we wanted to know how often people worry about dying, how accurately they can remember their high school graduations, how quickly they can solve a logic puzzle, or how much electrical activity their brains produce when they feel jealous, then simply watching them from the bushes will not do.
CULTURE & COMMUNITY: Best Place to Fall on Your Face
Robert Levine of California State University–
The results showed that people helped in all three events fairly evenly within cities, but there was a wide range of response between cities. Rio de Janeiro, Brazil, came out on top as the most helpful city in the study with an overall helping score of 93 percent. Kuala Lampur, Malaysia, came in last with a score of 40 percent, and New York City placed next to last with a score of 45 percent. On average, Latin American cities ranked as most helpful (Levine, Norenzayan, & Philbrick, 2001).

Luckily, there are other ways to avoid demand characteristics. For instance, people are less likely to be influenced by demand characteristics when they cannot be identified as the originators of their actions, and psychologists often take advantage of this fact by allowing people to respond privately (e.g., by having them complete questionnaires when they are alone) or anonymously (e.g., by not collecting personal information, such as the person’s name or address). Another technique that psychologists often use to avoid demand characteristics is to measure behaviours that cannot easily be demanded. For instance, a person’s behaviour cannot be influenced by demand characteristics if that behaviour is not under the person’s voluntary control. You may not want a psychologist to know that you are extremely interested in the celebrity gossip magazine that he or she has asked you to read, but you cannot prevent your pupils from dilating, which is what they do when you are engaged. Behaviours are also unlikely to be influenced by demand characteristics when people do not know that the demand and the behaviour are related. For example, you may want the psychologist to believe that you are concentrating hard on the Wall Street Journal article that he or she has asked you to read, but you probably do not realize that your blink rate slows when you are concentrating, thus you probably will not fake a slow blink.
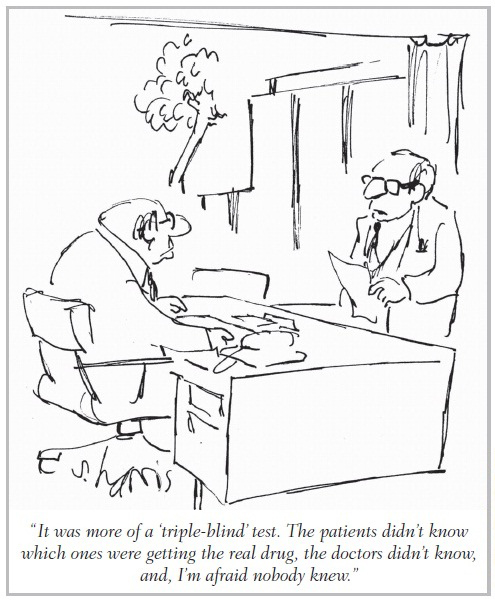
One of the best ways to avoid demand characteristics is to keep the people who are being observed from knowing the true purpose of the observation. When people are “blind” to the purpose of an observation, they cannot behave the way they think they should behave because they do not know how they should behave. For instance, if you did not know that a psychologist was studying the effects of music on mood, you would not feel obligated to smile when music was played. This is why psychologists typically do not reveal the true purpose of an observation to the people who are being observed until the study is over.
Why is it important for subjects to be “blind”?
Of course, people are clever and curious, and when psychologists do not tell them the purpose of their observations, people generally try to figure it out for themselves. That is why psychologists sometimes use cover stories, or misleading explanations that are meant to keep people from discerning the true purpose of an observation. For example, if a psychologist wanted to know how music influenced your mood, he or she might falsely tell you that the purpose of the study was to determine how quickly people can do logic puzzles while music plays in the background. (We will discuss the ethical implications of deceiving people later in this chapter.) In addition, the psychologist might use filler items, or pointless measures that are designed to mislead you about the true purpose of the observation. So, for example, the psychologist might ask you a few questions whose answers are of real interest to him or her (How happy are you right now?), as well as a few questions whose answers are not (Do you like cats more or less than dogs?). This makes it difficult for you to guess the true purpose of the observation from the nature of the questions you were asked.
2.2.1.4 Observer Bias
The people being observed are not the only ones who can make measurement a bit tricky. In one study, students in a psychology class were asked to measure the speed with which a rat learned to run through a maze (Rosenthal & Fode, 1963). Some students were told that their rat had been specially bred to be “maze-
Why is it important for experimenters to be “blind”?
Why did this happen? First, expectations can influence observations. It is easy to make errors when measuring the speed of a rat, and our expectations often determine the kinds of errors we make. Does putting one paw over the finish line count as learning the maze? If the rat falls asleep, should the stopwatch be left running or should the rat be awakened and given a second chance? If a rat runs a maze in 18.5 seconds, should that number be rounded up or rounded down before it is recorded in the log book? The answers to these questions may depend on whether one thinks the rat is bright or dull. The students who timed the rats probably tried to be honest, vigilant, fair, and objective, but their expectations influenced their observations in subtle ways that they could neither detect nor control. Second, expectations can influence reality. Students who expected their rats to learn quickly may have unknowingly done things to help that learning along for example, by muttering, “Oh no!” when the bright rat looked the wrong direction or by petting the dull rat less affectionately. (We will discuss both of these phenomena more extensively in the Social Psychology chapter.)
Observers’ expectations, then, can have a powerful influence on both their observations and on the behaviour of those whom they observe. Psychologists use many techniques to avoid these influences, and one of the most common is the double-blind observation, which is an observation whose true purpose is hidden from both the observer and the person being observed. For example, if the students had not been told which rats were bright and which were dull, then they would not have had any expectations about their rats, thus their expectations could not have influenced their measurements. That is why it is common practice in psychology to keep the observers as blind as the participants. For example, measurements are often made by research assistants who do not know what is being studied or why, and who therefore do not have any expectations about what the people being observed will or should do. Indeed, studies nowadays are often carried out by the world’s blindest experimenter—
2.2.2 Descriptions
You now know how to generate a valid operational definition, how to design a reliable and powerful instrument, and how to use that instrument while avoiding demand characteristics and observer bias. Suppose you use this knowledge to conduct an experiment. You now have a big page filled with numbers—
2.2.2.1 Graphic Representations
What is a frequency distribution?
A picture may be worth a thousand words, but it is worth a million digits. As you will learn in the Sensation and Perception chapter, vision is our most sophisticated sense, and human beings typically find it easier to understand things when they are represented visually than numerically or verbally. Psychologists are people too, and they often create graphic representations of the measurements they collect. The most common kind is the frequency distribution, which is a graphic representation of measurements arranged by the number of times each measurement was made. FIGURE 2.2 shows a pair of frequency distributions that represent the hypothetical performances of a group of men and women who took a test of fine motor skills (i.e., the ability to manipulate things with their hands). Every possible test score is shown on the horizontal axis. The number of times (or the frequency with which) each score was observed is shown on the vertical axis. Although a frequency distribution can have any shape, a common shape is the bell curve, which is technically known as the Gaussian distribution or the normal distribution, which is a mathematically defined distribution in which the frequency of measurements is highest in the middle and decreases symmetrically in both directions. The mathematical definition of the normal distribution is not important. (Well, for you anyway. For statisticians it is slightly more important than breathing.) What is important for you is what you can easily see for yourself: The normal distribution is symmetrical (i.e., the left half is a mirror image of the right half), has a peak in the middle, and trails off at both ends.
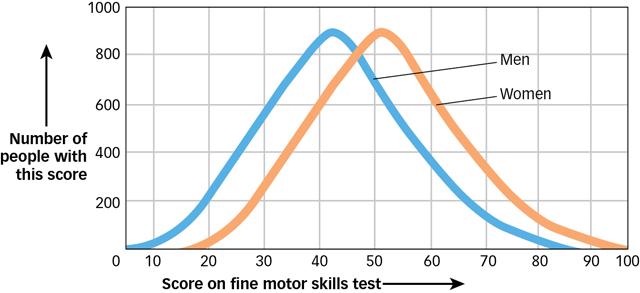
The picture in Figure 2.2 reveals—
2.2.2.2 Descriptive Statistics
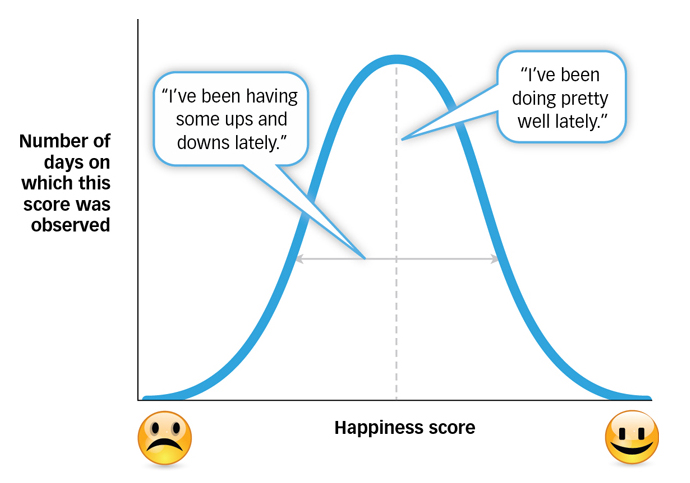
A frequency distribution depicts every measurement and thus provides a full and complete picture of those measurements. But sometimes a full and complete picture is just too much information. When you ask a friend how she is, you do not want her to show you a frequency distribution of her happiness scores on each day of the previous 6 months. You want a brief summary statement that captures the essential information that such a graph would provide (e.g., “I have been doing pretty well,” or, “I have been having some ups and downs lately”). In psychology, brief summary statements that capture the essential information from a frequency distribution are called descriptive statistics. There are two important kinds of descriptive statistics: those that describe the central tendency of a frequency distribution and those that describe the variability in a frequency distribution.
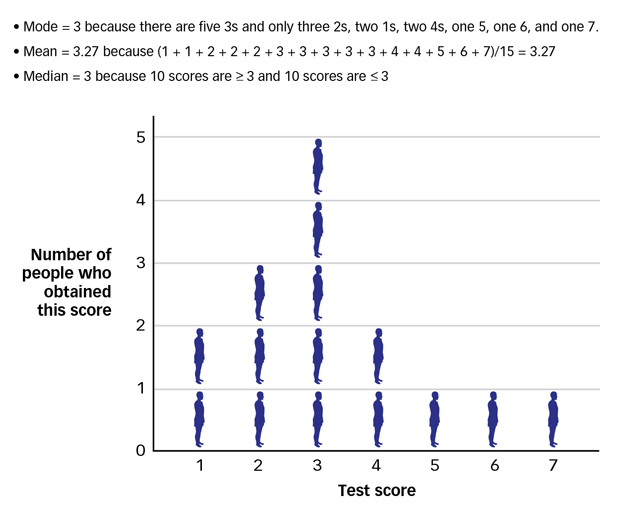
Descriptions of central tendency are statements about the value of the measurements that tend to lie near the centre or midpoint of the frequency distribution. When a friend says that she is “doing pretty well,” she is describing the central tendency (or approximate location of the midpoint) of the frequency distribution of her happiness over time (see FIGURE 2.3). The three most common descriptions of central tendency are: the mode (the value of the most frequently observed measurement); the mean (the average value of all the measurements); and the median (the value that is in the middle, i.e., greater than or equal to half the measurements and less than or equal to half the measurements). FIGURE 2.4 shows how each of these descriptive statistics is calculated. When you hear a descriptive statistic such as “the average university undergraduate sleeps 8.3 hours per day,” you are hearing about the central tendency of a frequency distribution (in this case, the mean).
What are the two major kinds of descriptive statistics?
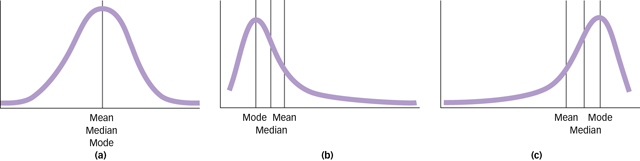
In a normal distribution, the mean, median, and mode all have the same value, but when the distribution is not normal, these three descriptive statistics can differ. For example, imagine that you measured the net worth of 40 university professors, and Mark Zuckerberg (a co-

Whereas descriptions of central tendency are statements about the location of the measurements in a frequency distribution, descriptions of variability are statements about the extent to which the measurements differ from each other. When a friend says that she has been “having some ups and downs lately,” she is offering a brief summary statement that describes how measurements of her happiness taken at different times tend to differ from one another. The simplest description of variability is the range, which is the value of the largest measurement in a frequency distribution minus the value of the smallest measurement. When the range is small, the measurements do not vary as much as when the range is large. The range is easy to compute, but like the mean it can be dramatically affected by a single measurement. If you said that the net worth of people you had measured ranged from $40 000 to $14 billion, a listener might get the impression that these people were all remarkably different from each other when, in fact, they were all quite similar save for one very rich guy in California.
What are two measures of variability?
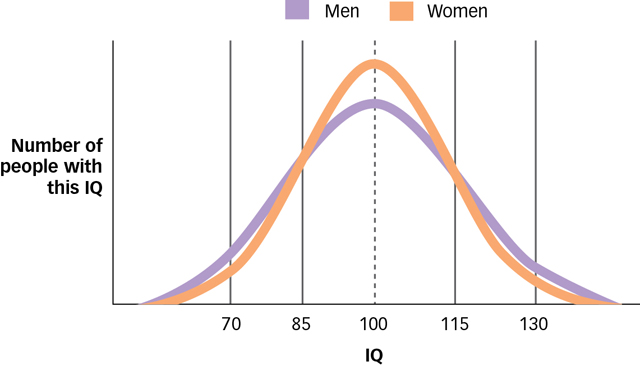
Other descriptions of variability are not quite as susceptible to this problem. For example, the standard deviation is a statistic that describes the average difference between the measurements in a frequency distribution and the mean of that distribution. In other words, on average, how far are the measurements from the centre of the distribution? As FIGURE 2.6 shows, two frequency distributions can have the same mean, but very different ranges and standard deviations. For example, studies show that men and women have the same mean IQ, but that men have a larger range and standard deviation, which is to say that a man is more likely than a woman to be much more or much less intelligent than the average person of his or her own sex.
Measurement involves defining a property in terms of a concrete condition, and then constructing a measure that can detect that condition. A good measure is valid (the concrete conditions it measures are conceptually related to the property of interest), reliable (it produces the same measurement whenever it is used to measure the same thing), and powerful (it can detect the concrete conditions when they actually exist).
When people know they are being observed, they may behave as they think they should. Demand characteristics are features of a setting that suggest to people that they should behave in a particular way. Psychologists try to reduce or eliminate demand characteristics by observing participants in their natural habitats or by hiding their expectations from the participant. Observer bias is the tendency for observers to see what they expect to see or cause others to behave as they expect them to behave. Psychologists try to eliminate observer bias by making double-
blind observations. Psychologists often describe the measurements they make with a graphic representation called a frequency distribution, which often has a special shape known as the normal distribution. They also describe their measurements with descriptive statistics; the most common are descriptions of central tendency (such as mean, median, and mode) and descriptions of variability (such as range and standard deviation).