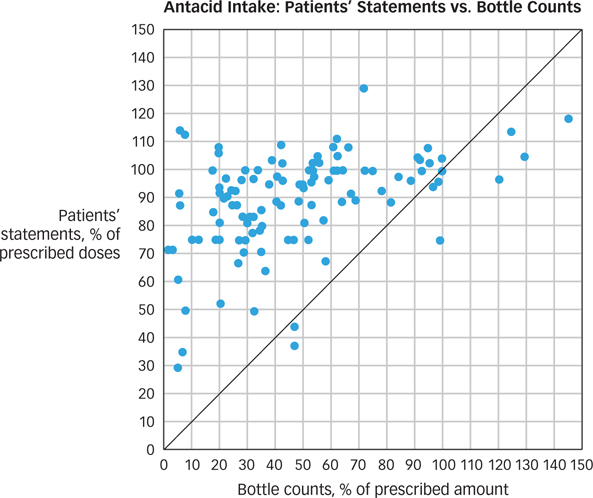
FIGURE 13.5 Antacid Intake This graph shows a scatterplot of antacid intake measured by bottle count plotted against patient’s stated intake for 116 patients. When the actual and stated intakes are the same, the point lies on the diagonal line; when stated intake is greater than actual, the point lies above the line. Most patients exaggerated their intakes. (Data from Roth & Caron, 1978.)
[Leave] [Close]