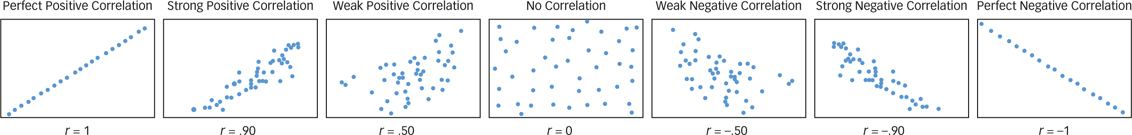
FIGURE A.6
Examples of Correlations
This figure shows correlations of different signs and strengths. Notice how the pattern of data changes as r moves from 1 to −1.
[
Leave
] [
Close
]
Next