16.2 Descriptive Statistics
A frequency distribution depicts every measurement and thus provides a full and complete picture of those measurements. But sometimes a full and complete picture is just too much information. When we ask a friend how she’s been, we don’t want her to show us a frequency distribution of her happiness scores; we want a brief summary statement such as “I’ve been doing pretty well” or “I’ve been having some ups and downs lately.” In psychology, brief summary statements that capture the essential information from a frequency distribution are called descriptive statistics. There are two important kinds of descriptive statistics: those that describe the central tendency of a frequency distribution and those that describe the variability in a frequency distribution.
Central Tendency
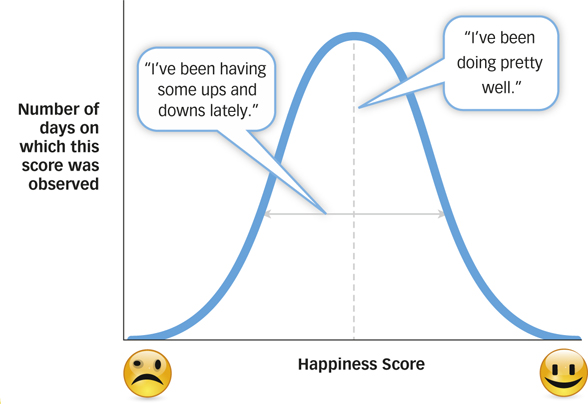
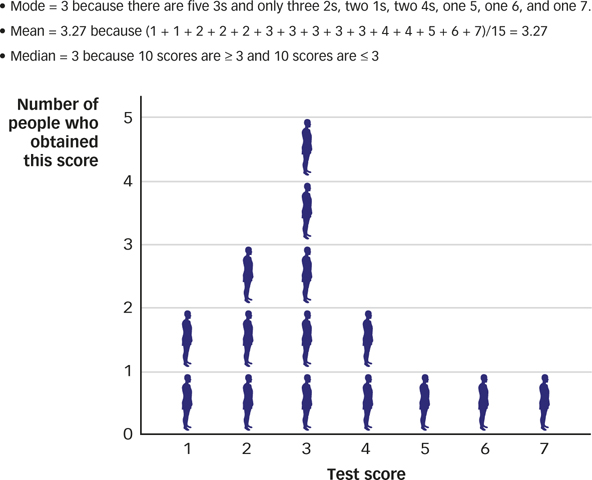
Descriptions of central tendency are statements about the value of the measurements that tend to lie near the center or midpoint of the frequency distribution. When a friend says “I’ve been doing pretty well,” she is describing the central tendency (or approximate location of the midpoint) of the frequency distribution of her happiness over time (see FIGURE A.2). The three most common descriptions of central tendency are: the mode (the value of the most frequently observed measurement), the mean (the average value of all the measurements), and the median (the value that is in the middle; i.e., greater than or equal to half the measurements and less than or equal to half the measurements). FIGURE A.3 shows how each of these descriptive statistics is calculated.
mode
The value of the most frequently observed measurement.
mean
The average value of all the measurements.
median
The value that is in the middle; that is, greater than or equal to half the measurements and less than or equal to half the measurements.
A-
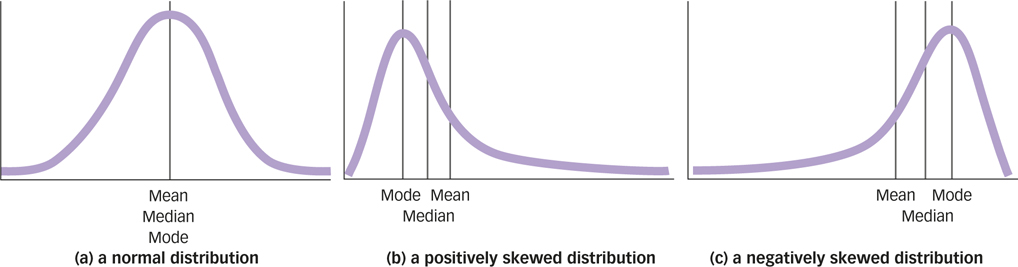
In a normal distribution, the mean, median, and mode all have the same value, but when the distribution is not normal, these three descriptive statistics can differ. For example, imagine that you measured the net worth of 40 college professors and Facebook founder Mark Zuckerberg. The frequency distribution of your measurements would not be normal, but would instead be positively skewed. As you can see in FIGURE A.4, the mode and the median of positively skewed distribution (b) are lower than the mean because the mean is more strongly influenced by the value of a single extreme measurement (which, in case you’ve been sleeping for the last few years, would be the net worth of Mark Zuckerberg). When distributions become skewed, the mean gets dragged off toward the tail, the mode stays home at the hump, and the median goes to live between the two.
When distributions are skewed, a single measure of central tendency can paint a misleading picture of the measurements. For example, the mean net worth of the people you measured is probably about a billion dollars each, but that statement makes the college professors sound a whole lot richer than they are. You could provide a much better description of the net worth of the people you measured if you also mentioned that the median net worth is $300,000 and that the modal net worth is $288,000. Indeed, you should always be suspicious when you hear some new fact about “the average person” but don’t hear anything about the shape of the frequency distribution.
Variability
Whereas descriptions of central tendency are statements about the location of the measurements in a frequency distribution, descriptions of variability are statements about the extent to which the measurements differ from each other. When a friend says “I’ve been having some ups and downs lately,” she is offering a brief summary statement that describes how measurements of her happiness taken at different times tend to differ from one another. The simplest description of variability is the range, which is the value of the largest measurement in a frequency distribution minus the value of the smallest measurement. The range is easy to compute, but like the mean, it can be dramatically affected by a single measurement. If you said that the net worth of people you had measured in the previous example ranged from $40,000 to $14 billion, a listener might get the impression that these people were all remarkably different from each other when, in fact, they were all quite similar save for one very rich guy.
range
The value of the largest measurement in a frequency distribution minus the value of the smallest measurement.
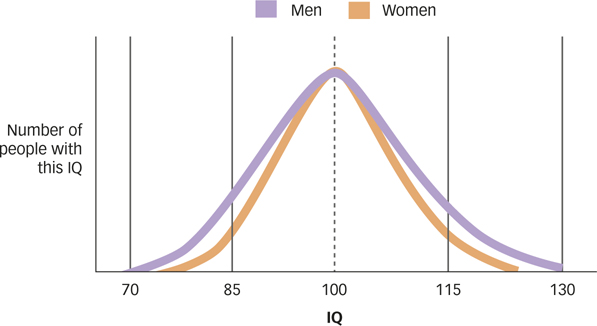
Other descriptions of variability aren’t quite as susceptible to this problem. For example, the standard deviation is a statistic that describes the average difference between the mean of a frequency distribution and each of the measurements in that distribution. In other words, how different are the measurements from each other on average? As FIGURE A.5 shows, two frequency distributions that have the same central tendencies can have very different ranges and standard deviations. For example, many studies suggest that men and women have about the same mean IQ, but that men have a larger range and standard deviation, which is to say that a man is more likely than a woman to be either extremely intelligent or extremely unintelligent.
standard deviation
A statistic that describes the average difference between the measurements in a frequency distribution and the mean of that distribution.
A-