3.6 Investigating the Brain
So far, you’ve read a great deal about the nervous system: how it’s organized, how it works, what its components are, and what those components do. But how do we know all of this? Anatomists can dissect a human brain and identify its structures, but they cannot determine which structures play a role in producing which behaviors by dissecting a nonliving brain.
Scientists use a variety of methods to understand how the brain affects behavior. Let’s consider three of the main ones: studying people with brain damage; studying the brain’s electrical activity; and using brain imaging to study brain structure and watch the brain in action.
Studying the Damaged Brain
To understand the normal operation of a process better, it is instructive to understand what happens when that process fails. Much research in neuroscience correlates the loss of specific perceptual, motor, emotional, or cognitive functions with specific areas of brain damage (Andrewes, 2001; Kolb & Whishaw, 2003). By studying these instances of lost functions, neuroscientists can theorize about the functions those brain areas normally perform.
How have brain disorders been central to the study of specific areas of the brain?
83
The Emotional Functions of the Frontal Lobes
As you’ve already seen, the human frontal lobes are a remarkable evolutionary achievement. However, psychology’s first glimpse at some functions of the frontal lobes came from a rather unremarkable fellow—
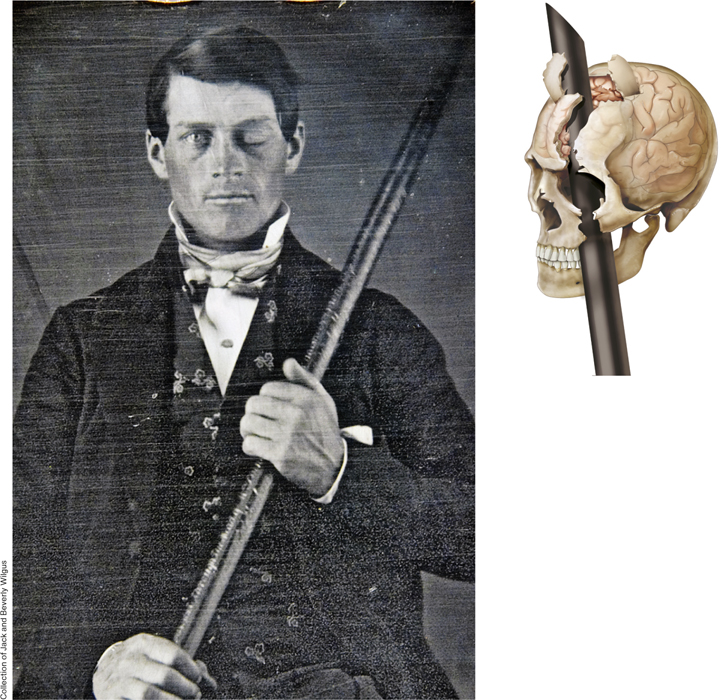
Before the accident, Gage had been mild mannered, quiet, conscientious—
The Distinct Roles of the Left and Right Hemispheres
You’ll recall that the cerebral cortex is divided into two hemispheres, although typically the two hemispheres act as one integrated unit. Sometimes, though, disorders can threaten the ability of the brain to function, and the only way to stop them is with radical methods. This is sometimes the case for people who suffer from severe, intractable epilepsy. Seizures that begin in one hemisphere cross the corpus callosum (the thick band of nerve fibers that allows the two hemispheres to communicate) to the opposite hemisphere and start a feedback loop that results in a kind of firestorm in the brain. To alleviate the severity of the seizures, surgeons can sever the corpus callosum in a procedure called a split-
84
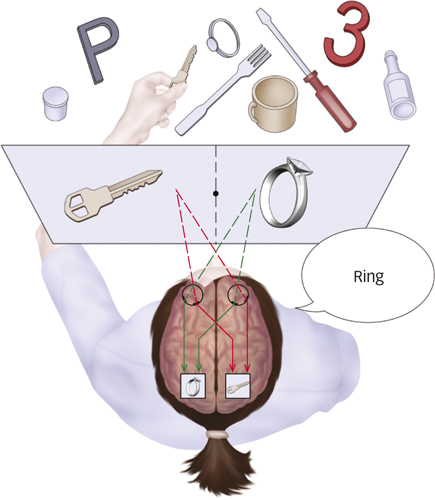
Normally, any information that initially enters the left hemisphere is also registered in the right hemisphere and vice versa: The information comes in and travels across the corpus callosum, and both hemispheres understand what’s going on (see FIGURE 3.22). But in a person with a split brain, information entering one hemisphere stays there. Nobel laureate Roger Sperry (1913–
These split-
Studying the Brain’s Electrical Activity
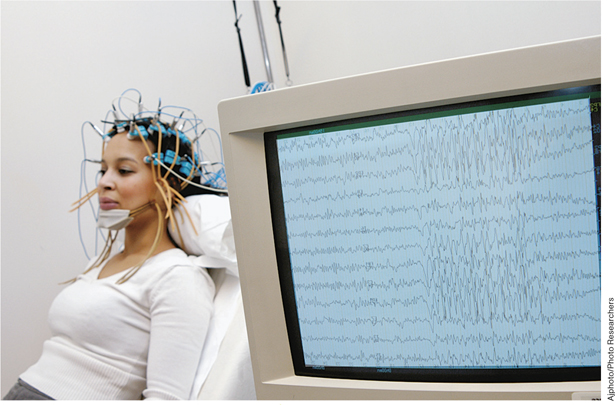
How does the EEG record electrical activity in the brain?
A second approach to studying the link between brain structures and behavior involves recording the pattern of electrical activity of neurons. An electroencephalograph (EEG) is a device used to record electrical activity in the brain. Typically, electrodes are placed on the outside of the head, and even though the source of electrical activity in synapses and action potentials is far removed from these wires, the electric signals can be amplified several thousand times by the EEG. This provides a visual record of the underlying electrical activity, as shown in FIGURE 3.23. Using this technique, researchers can determine the amount of brain activity during different states of consciousness. For example, as you’ll read in the Consciousness chapter, the brain shows distinctive patterns of electrical activity when awake versus asleep; in fact, there are even different brain-
85
A different approach to recording electrical activity resulted in a more refined understanding of the brain’s division of responsibilities, even at a cellular level. Nobel laureates David Hubel and Torsten Wiesel used a technique in which they inserted electrodes into the occipital lobes of anesthetized cats and observed the patterns of action potentials of individual neurons (Hubel, 1988). They discovered that neurons in the primary visual cortex are activated whenever a contrast between light and dark occurs in part of the visual field, such as a thick line of light against a dark background. They then found that each neuron responded vigorously only when presented with a contrasting edge at a particular orientation. Since then, many studies have shown that neurons in the primary visual cortex represent particular features of visual stimuli, such as contrast, shape, and color (Zeki, 1993).
These neurons in the visual cortex are known as feature detectors because they selectively respond to certain aspects of a visual image. For example, some neurons fire only when detecting a vertical line in the middle of the visual field, other neurons fire when a line at a 45° angle is perceived, and still others react in response to wider lines, horizontal lines, lines in the periphery of the visual field, and so on (Livingstone & Hubel, 1988). The discovery of this specialized function for neurons was a huge leap forward in our understanding of how the visual cortex works. Feature detectors identify basic dimensions of a stimulus (“slanted line … other slanted line … horizontal line”); those dimensions are then combined during a later stage of visual processing to allow recognition and perception of a stimulus (“Oh, it’s a letter A”).
Using Brain Imaging to Study Structure and to Watch the Brain in Action
The third major way that neuroscientists can peer into the workings of the human brain involves neuroimaging techniques that use advanced technology to create images of the living, healthy brain (Posner & Raichle, 1994; Raichle & Mintun, 2006). Structural brain imaging provides information about the basic structure of the brain and allows clinicians or researchers to see abnormalities in brain structure. Functional brain imaging, in contrast, provides information about the activity of the brain when people perform various kinds of cognitive or motor tasks.
Structural Brain Imaging
One of the first neuroimaging techniques developed was the computerized axial tomography (CT) scan. In a CT scan, a scanner rotates a device around a person’s head and takes a series of X-
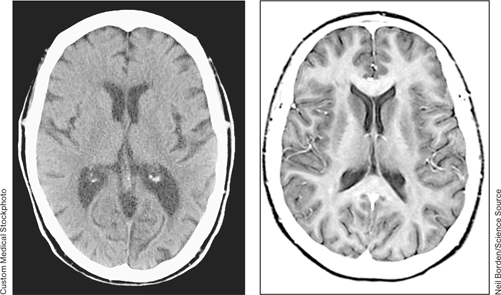
Neil Borden/Science Source
Magnetic resonance imaging (MRI) uses a strong magnetic field to line up the nuclei of specific molecules in the brain tissue. Brief, but powerful, pulses of radio waves cause the nuclei to rotate out of alignment. When a pulse ends, the nuclei snap back in line with the magnetic field and give off a small amount of energy in the process. Different molecules have unique energy signatures when they snap back in line with the magnetic field, so these signatures can be used to reveal brain structures with different molecular compositions. MRI produces pictures of soft tissue at a better resolution than a CT scan, as you can see in FIGURE 3.24. Both CT and MRI scans give psychologists a picture of the structure of the brain and can help localize brain damage (as when someone suffers a stroke), but they reveal nothing about the functions of the brain.
86
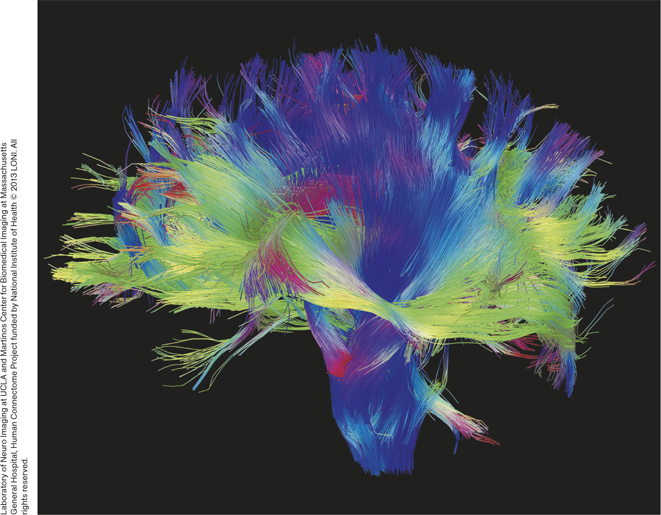
Diffusion tensor imaging (DTI) is a relatively recently developed type of MRI that is used to visualize white matter pathways, which are fiber bundles that connect both nearby and distant brain regions to one another. DTI measures the rate and direction of diffusion or movement of water molecules along white matter pathways. Scientists can use measures based on the rate and direction of diffusion to assess the integrity of a white matter pathway, which is very useful in cases of neurological and psychological disorders (Thomason & Thompson, 2011). DTI plays a central role in an ambitious undertaking known as the Human Connectome Project, a collaborative effort funded by the National Institutes of Health beginning in 2009, that aims to provide a complete map of the connectivity of neural pathways in the brain: the human connectome (Toga et al., 2012). Researchers have made available some of their results at their Web site (www.humanconnectomeproject.org), which include fascinating colorful images of some of the connection pathways they have discovered.
Functional Brain Imaging
Functional brain imaging techniques show researchers much more than just the structure of the brain by allowing us to watch the brain in action. These techniques rely on the fact that activated brain areas demand more energy for their neurons to work. This energy is supplied through increased blood flow to the activated areas. Functional imaging techniques can detect such changes in blood flow. In positron emission tomography (PET), a harmless radioactive substance is injected into a person’s bloodstream. Then the brain is scanned by radiation detectors as the person performs perceptual or cognitive tasks, such as reading or speaking. Areas of the brain that are activated during these tasks demand more energy and greater blood flow, resulting in a higher amount of the radioactivity in that region. The radiation detectors record the level of radioactivity in each region, producing a computerized image of the activated areas (see FIGURE 3.25).
87
For psychologists, the most widely used functional brain imaging technique nowadays is functional magnetic resonance imaging (fMRI), which detects the difference between oxygenated hemoglobin and deoxygenated hemoglobin when exposed to magnetic pulses. Hemoglobin is the molecule in the blood that carries oxygen to our tissues, including the brain. When active neurons demand more energy and blood flow, oxygenated hemoglobin concentrates in the active areas; fMRI detects the oxygenated hemoglobin and provides a picture of the level of activation in each brain area (see FIGURE 3.25). Just as MRI was a major advance over CT scans, functional MRI represents a similar leap in our ability to record the brain’s activity during behavior. Both fMRI and PET produce images that show activity in the brain while the person performs certain tasks. However, fMRI has a couple of advantages over PET. First, fMRI does not require any exposure to a radioactive substance. Second, fMRI can localize changes in brain activity across briefer periods than PET, which makes it more useful for analyzing psychological processes that occur extremely quickly, such as reading a word or recognizing a face. For example, when people look at faces, fMRI reveals strong activity in a region located near the border of the temporal and occipital lobes called the fusiform gyrus (Kanwisher, McDermott, & Chun, 1997). When this structure is damaged, people experience problems recognizing faces—
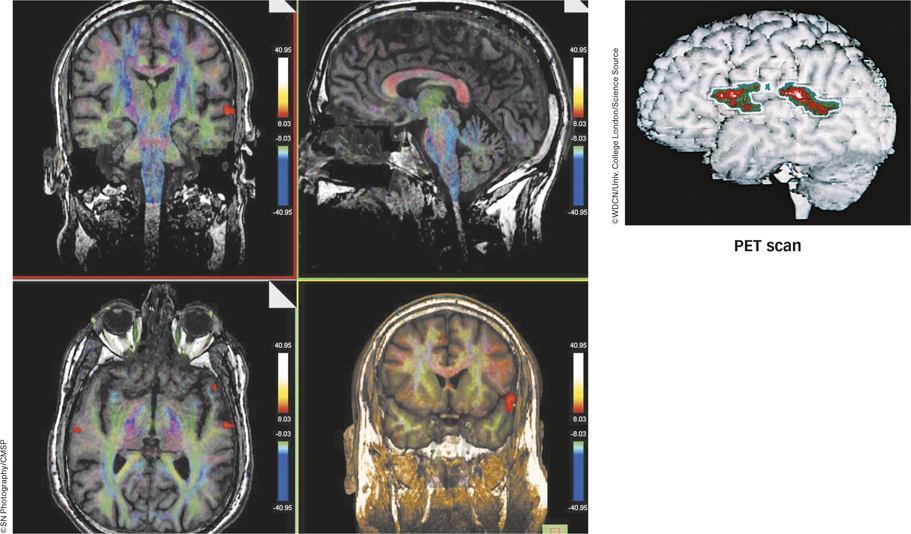
©WDCN/Univ. College London/Science Source
What does an fMRI track in an active brain?
Functional MRI can also be used to explore the relationship of brain regions with one another, using a recently developed technique referred to as resting state functional connectivity. As implied by the name, this technique does not require participants to perform a task; they simply rest quietly while fMRI measurements are made. Functional connectivity measures the extent to which spontaneous activity in different brain regions is correlated over time; brain regions whose activity is highly correlated are thought to be functionally connected with one another (Lee, Smyser, & Shimony, 2013). Functional connectivity measures have been used extensively in recent years to identify brain networks, that is, sets of brain regions that are closely connected to one another (Yeo et al., 2011). For example, functional connectivity helped to identify the default network (Gusnard & Raichle, 2001), a group of interconnected regions in the frontal, temporal, and parietal lobes that is involved in internally focused cognitive activities, such as remembering past events, imagining future events, daydreaming, and mind wandering (Andrews-
88
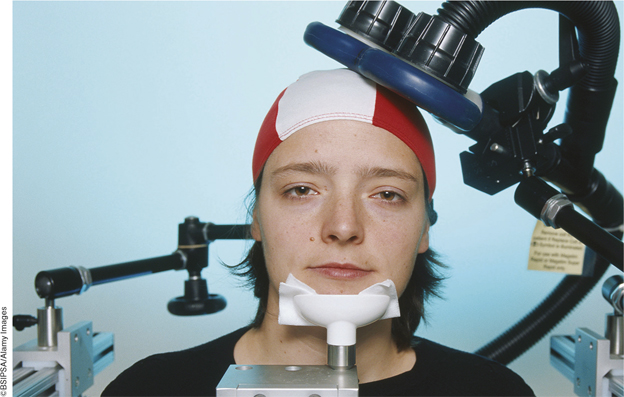
Transcranial Magnetic Stimulation
We noted earlier that scientists have learned a lot about the brain by studying the behavior of people with brain injuries. But, although brain damage may be related to particular patterns of behavior, that relationship may or may not be causal. Experimentation is the premier method for establishing causal relationships between variables, but scientists cannot ethically cause brain damage in human beings just to see how behavior might be affected. Functional neuroimaging techniques such as fMRI don’t help on this point because they do not provide information about when a particular pattern of brain activity causes a particular behavior.
Happily, scientists have discovered a way to mimic brain damage with a benign technique called transcranial magnetic stimulation (TMS; Barker, Jalinous, & Freeston, 1985; Hallett, 2000). TMS delivers a magnetic pulse that passes through the skull and deactivates neurons in the cerebral cortex for a short period. Researchers can direct TMS pulses to particular brain regions (essentially turning them off) and then measure temporary changes in the way a person moves, sees, thinks, remembers, speaks, or feels. By manipulating the state of the brain, scientists can perform experiments that establish causal relationships.
For example, in an early study using TMS, scientists discovered that magnetic stimulation of the visual cortex temporarily impairs a person’s ability to detect the motion of an object without impairing the person’s ability to recognize that object (Beckers & Zeki, 1995). This intriguing discovery suggests that motion perception and object recognition are accomplished by different parts of the brain, but moreover, it establishes that activity in the visual cortex causes motion perception. More recent research has revealed that applying TMS to the specific part of the visual cortex responsible for motion perception also impairs the accuracy with which people reach for moving objects (Schenk et al., 2005) or for stationary objects when there is motion in the background of a visual scene (Whitney et al., 2007). These findings indicate that the visual motion area plays a crucial role in guiding actions when we’re responding to motion in the visual environment.
Rather than relying solely on observational studies of people with brain injuries or the snapshots provided by fMRI or PET scans, researchers can also manipulate brain activity and measure its effects. Scientists have also begun to combine TMS with fMRI, allowing them to localize precisely where in the brain TMS is having its effect (Caparelli, 2007). Studies suggest that TMS has no harmful side effects (Anand & Hotson, 2002; Pascual-
89
Other Voices: Neuromyths
Neuromyths

You’ve no doubt often heard the phrase “we only use 10% of our brains,” and perhaps you’ve wondered whether there is anything to it. Chabris and Simons (2012) discussed this and other statements about the brain that they believe to be merely myths, based in part, on a recent study by Dekker, Howard-
Pop quiz: Which of these statements is false?
- We use only 10% of our brain.
- Environments rich in stimuli improve the brains of preschool children.
- Individuals learn better when they receive information in their preferred learning style, whether auditory, visual, or kinesthetic.
If you picked the first one, congratulations. The idea that we use only 10% of our brain is patently false. Yet it so permeates popular culture that, among psychologists and neuroscientists, it is known as the “10% myth.” Contrary to popular belief, the entire brain is put to use—
Did you agree with the other two statements? If so, you fell into our trap. All three statements are false—
These “neuromyths,” along with others, were presented to 242 primary and secondary school teachers in the Netherlands and the United Kingdom as part of a study by Sanne Dekker and colleagues at VU University Amsterdam and Bristol University, and just published in the journal Frontiers in Psychology. They found that 47% of the teachers believed the 10% myth. Even more, 76%, believed that enriching children’s environments will strengthen their brains.
This belief might have emerged from evidence that rats raised in cages with amenities like exercise wheels, tunnels, and other rats showed better cognitive abilities and improvements in brain structure compared with rats that grew up isolated in bare cages. But such experiments show only that a truly impoverished and unnatural environment leads to poorer developmental outcomes than a more natural environment with opportunities to play and interact. It follows that growing up locked in a closet or otherwise cut off from human contact will impair a child’s brain development. It does not follow that “enriching” a child’s environment beyond what is already typical (e.g., by constant exposure to “Baby Einstein”-type videos) will boost cognitive development.
The myth about learning styles was the most popular: 94% of the teachers believed that students perform better when lessons are delivered in their preferred learning style. Indeed, students do have preferences about how they learn; the problem is that these preferences have little to do with how effectively they learn ….
Our own surveys of the U.S. population have found even more widespread belief in myths about the brain. About two-
Ironically, in the Dekker group’s study, the teachers who knew the most about neuroscience also believed in the most myths. Apparently, teachers who are (admirably) enthusiastic about expanding their knowledge of the mind and brain have trouble separating fact from fiction as they learn. Neuromyths have so much intuitive appeal, and they spread so rapidly in fields like business and self-
If for some perverse reason you wanted to annoy the instructor of your psychology course, you probably could do no better than to claim that “we use only 10% of our brains.” Even though, as pointed out by Chabris and Simon (2012), a surprisingly high proportion of elementary and secondary school teachers in the Netherlands and the United Kingdom subscribe to this myth, we don’t know any psychologists teaching courses like the one you are taking who would endorse it, and we hope that there aren’t any. How did the myth get started? Nobody really knows. Some think that it may have arisen from a quotation by the great psychologist William James (“We are making use of only a small part of our possible mental and physical resources”) or that it possibly dates back to Albert Einstein’s attempt to make sense of his own massive intellect (Boyd, 2008).
The key point for our purposes is that when you hear such bold claims made, say, by a friend who heard it from somebody else, it’s time for you to put into action the kinds of critical thinking skills that we are focusing on in this text—
Reprinted by permission of the Wall Street Journal, Copyright © 2012 Dow Jones & Company, Inc. All Rights Reserved Worldwide. License numbers 3185501478402 and 3185510077103.
90
SUMMARY QUIZ [3.6]
Question 3.16
| 1. | Identifying the brain areas that are involved in specific types of motor, cognitive, or emotional processing is best achieved through |
- recording patterns of electrical activity.
- observing psychological disorders.
- psychosurgery.
- brain imaging.
d.
Question 3.17
| 2. | Split- |
- neurons in the primary visual cortex represent features of visual stimuli such as contrast, shape, and color.
- the two hemispheres perform different functions but can work together by means of the corpus callosum.
- when people perform a task that involves emotional processing, the amygdala is activated.
- brain locations for vision, touch, and hearing are separate.
b.
Question 3.18
| 3. | Researchers can observe relationships between energy consumption in certain brain areas and specific cognitive and behavioral events using _____________. |
- functional brain imaging
- electroencephalography
- electrodes that are inserted into individual cells
- CT scans
a.
91