Activity Type Title

Chapter 1. Chapter

Infographic

Scientific American: Psychology

Infographic Activity 1.4: The Correlation Coefficient

The Correlation Coefficient: What’s in a Number?

Press Enter if you want to enlarge this image

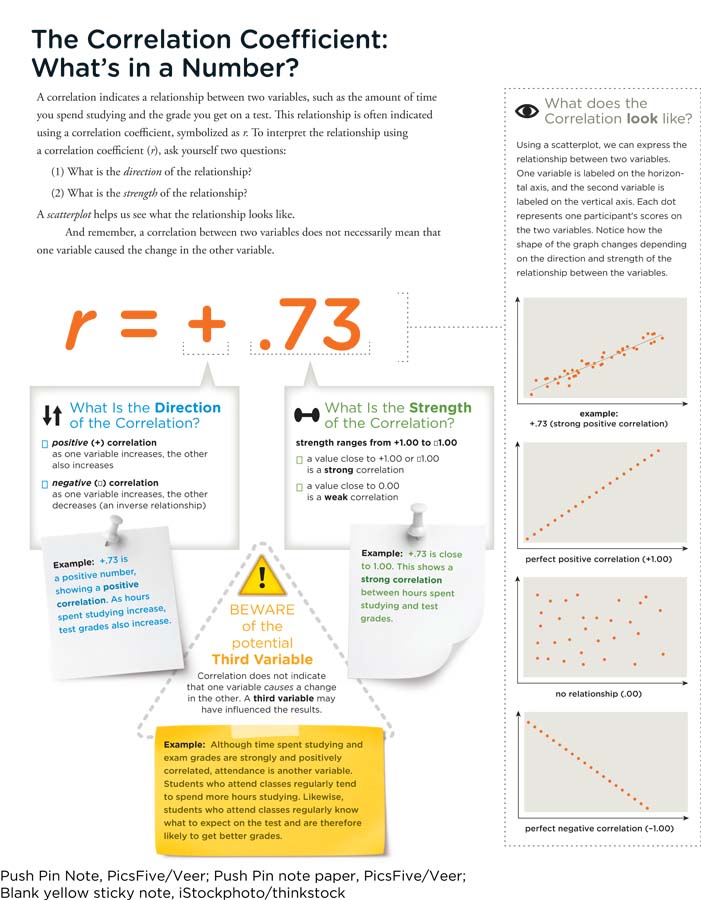
A correlation indicates a relationship between two variables, such as the amount of time you spend studying and the grade you get on a test. This relationship is often indicated using a correlation coefficient, symbolized as r. To interpret the relationship using a correlation coefficient (r), ask yourself two questions:

(1) What is the direction of the relationship?

(2) What is the strength of the relationship?

A scatterplot helps us see what the correlation looks like. And remember, a correlation between two variables does not necessarily mean the one variable caused the change in the other variable.

Click the image to enlarge.

Click "Next" to continue.


1.1 Quiz

1. What kind of visual representation would be the most useful for showing the correlation that exists between two variables?

A.
B.
C.
D.

Correct.
Incorrect.

2. While trying to determine the relationship between the temperature outside and the number of flies that she sees in her house, Mary makes observations of both factors for several weeks. She then computes a correlation coefficient. Which part of that coefficient will tell Mary the strength of the relationship between the two variables?

A.
B.
C.
D.

Correct.
Incorrect.

3. Christopher is taking an exam in his psychology course, and the question asks him to interpret a correlation coefficient. The coefficient in his question is statistically possible. Which of the following numbers could not be the coefficient in question?

A.
B.
C.
D.

Correct.
Incorrect.

4. Why is it that psychologists cannot state that a correlation between two variables indicates that a change in one causes a change in the other?

A.
B.
C.
D.

Correct.
Incorrect.

5. The more Brandon cleans his kitchen, the less dirt he sees on the counters and floor. In this example, the correlation between the variables “amount of cleaning” and “amount of dirt” would be best described by which of the following coefficients?

A.
B.
C.
D.

Correct.
Incorrect.

6. A correlation coefficient is usually indicated by the symbol _____.

A.
B.
C.
D.

Correct.
Incorrect.

7. In a graphical depiction of a perfect negative correlation, which of the following shapes would you be most likely to see?

A.
B.
C.
D.

Correct.
Incorrect.

8. The relationship between the number of alcoholic beverages one can consume without becoming intoxicated and their hair color would probably be best described by which of the following correlation coefficients?

A.
B.
C.
D.

Correct.
Incorrect.