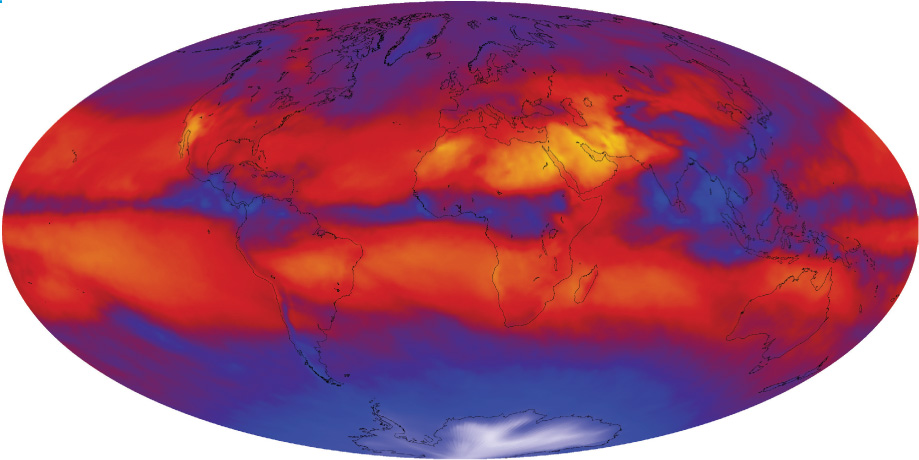
FIGURE 12.2
A global composite of CERES imagery from June 2010, showing the radiated energy from Earth (blue areas are colder, red areas are warmer).
(Source: Kevin Ward, NASA Earth Observations)