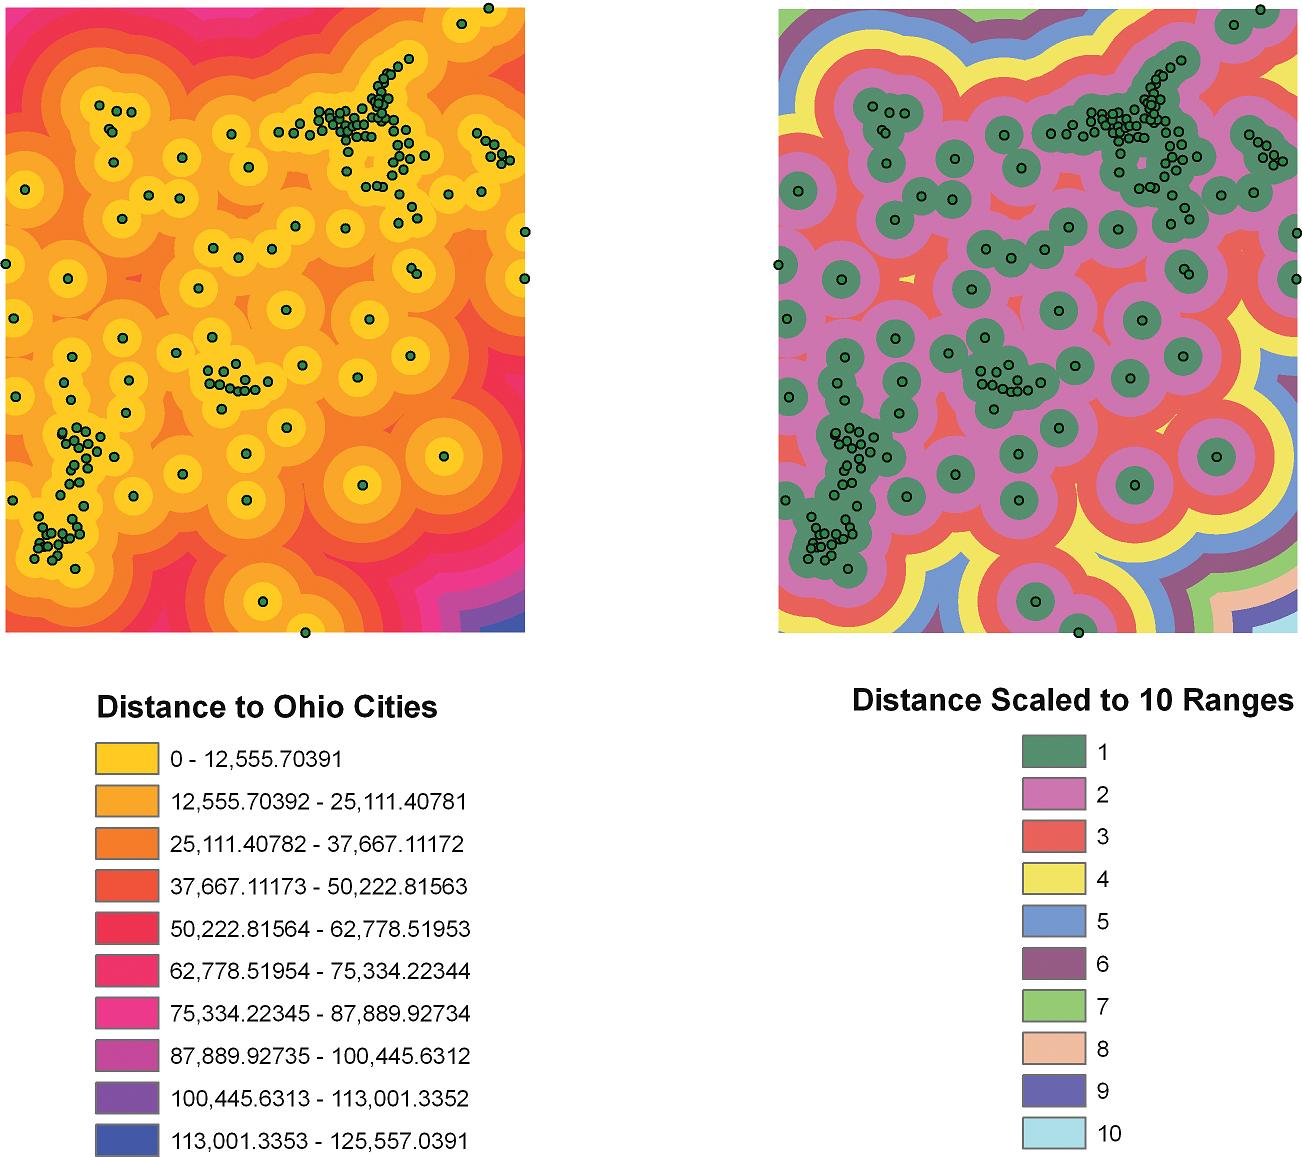
FIGURE 6.10
An example of a raster distance surface calculation, where each grid cell contains a value representing the distance from a point (cities in Ohio), and the same grid sliced into 10 ranges.
(Source: Esri)