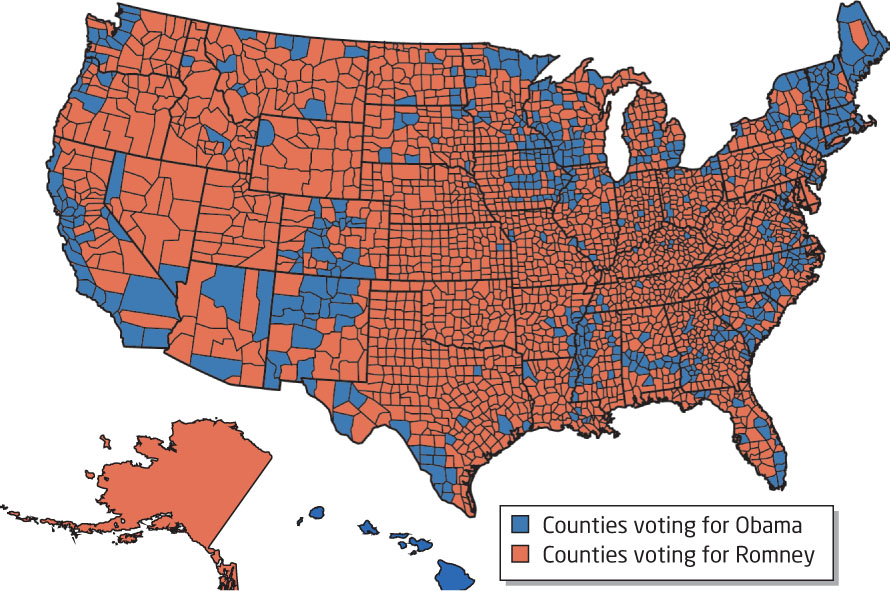
FIGURE 7.7
A thematic map showing the results of the 2012 U.S. Presidential election by county (the vote in blue counties going for Barack Obama and the vote in red counties going for Mitt Romney).