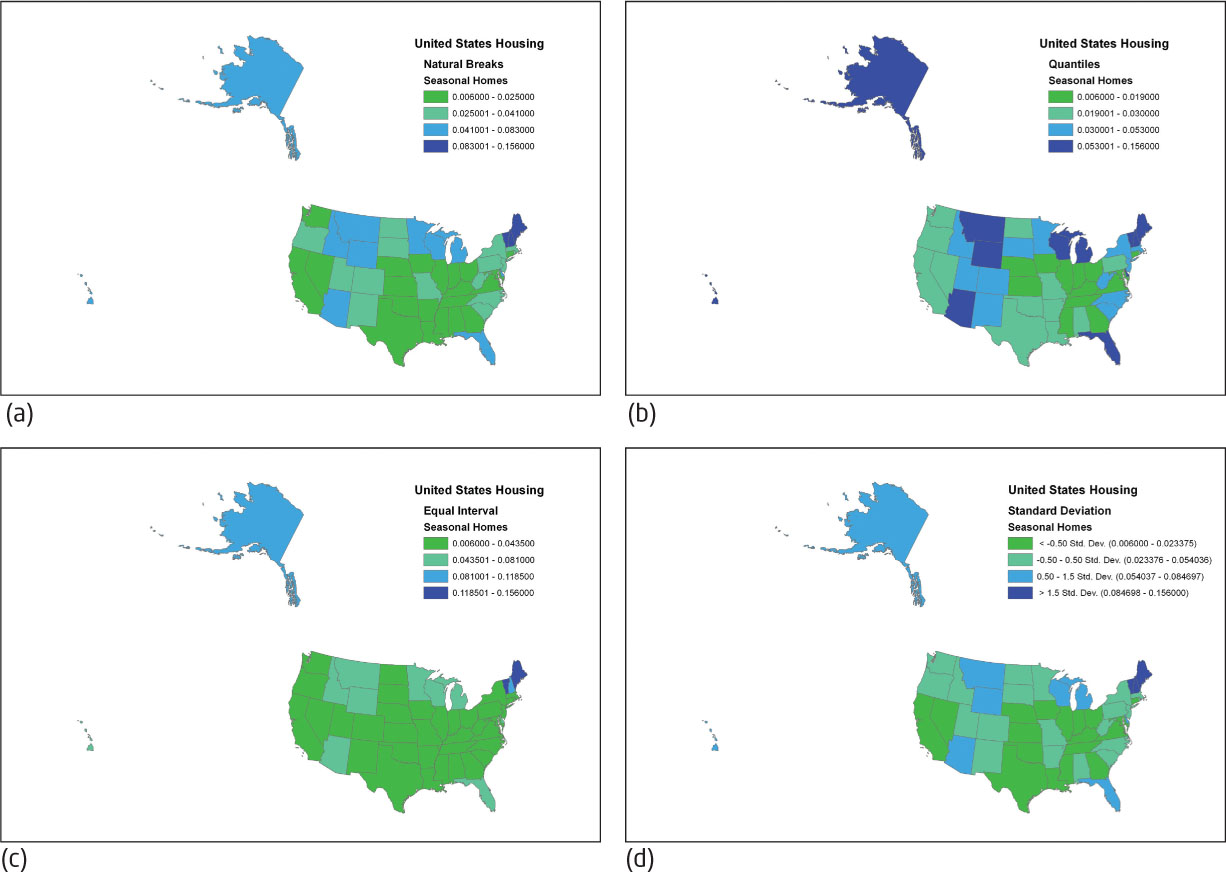
FIGURE 7.8 Four choropleth map examples created using the same data (the year 2000 percentage of the total number of houses that are considered seasonal or vacation homes), but employing different data classification methods, as follows: (a) Natural Breaks, (b) Quantiles, (c) Equal Interval, and (d) Standard Deviation.(Source: Esri)