10.4 
How Can Spectral Reflectance Be Used in Remote Sensing?
Everything on Earth’s surface reflects energy wavelengths differently from everything else. Green grass, bare soil, a parking lot, a sandy beach, and a large lake—all reflect portions of the visible, near-infrared, and middle-infrared energy differently (these items emit thermal energy differently as well). In addition, some things reflect energy differently depending on different conditions. As an example of examining these remote sensing concepts, let’s look at something simple—measuring reflectance of energy from the leaves on a tree. During late spring and summer, a tree canopy will be dense and full, as the leaves increase in number, stay on the trees, and are a healthy green color. The human eye sees healthy leaves as green because the chlorophyll in the leaves is reflecting the green portion of the spectrum and absorbing the red and blue portions. What can’t be seen by the human eye (but can be seen by remote sensing instruments) is that, due to their structure, healthy leaves also very strongly reflect near-infrared energy. Thus, measurement of near-infrared energy is often used (in part) as an indicator of the relative health of leaves and vegetation.
However, leaves aren’t always going to stay green. As autumn progresses, leaves go through a senescence process in which they lose their chlorophyll. As this happens, the leaves reflect less green energy and begin to absorb less (and thus, reflect more) red and blue energy, causing the leaves to appear in other colors, such as yellow, orange, and red. As the leaves turn brown and fall off the trees, they have a lot more red reflection, causing their brownish appearance (and there will also be less reflectance of near-infrared energy from the tree).
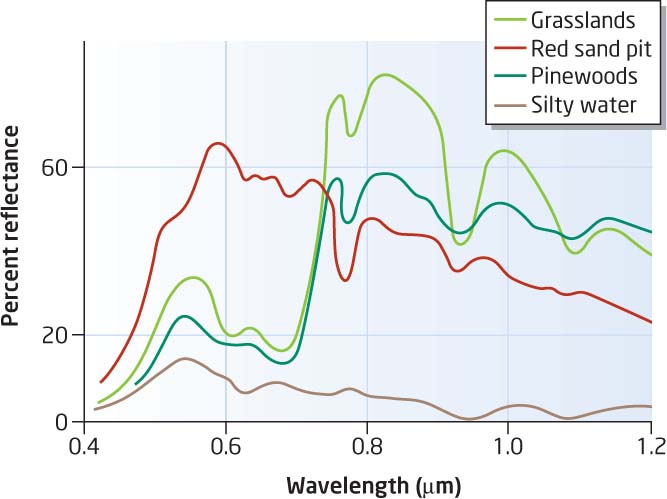
spectral signature a unique identifier for a particular item, generated by charting the percentage of reflected energy per wavelength against a value for that wavelength
If a sensor were able to measure all of these energy wavelengths simultaneously for different objects, it would give the person examining the data the ability to tell objects apart by examining their reflectance values in all of these wavelengths. If you were to chart the spectral reflectance values against the wavelengths being measured for each item, you would find that each of these things would have a different line on the chart. This is referred to as an item’s spectral signature (also called a spectral reflectance curve), as each set of charted measurements will be unique to that item, just like your handwritten signature on a piece of paper is different from everyone else’s. Remote sensing analysts can use these spectral signatures to distinguish items in an image and to tell the difference between different types of plants or minerals (see Figure 10.5 for comparisons of various spectral signatures).
NDVI (Normalized Difference Vegetation Index) a method of measuring the health of vegetation using near-infrared and red energy measurements
One useful application of remotely sensed imagery is its use in assessing the health of green vegetation (such as fields, grass, and foliage). When vegetation is very healthy, it will have a strong reflection of near-infrared energy and absorption of red energy. As the vegetation becomes more stressed, less near-infrared energy will be reflected and more red energy will be reflected rather than absorbed. An image can be processed to measure the health of various kinds of vegetation. The Normalized Difference Vegetation Index (NDVI) is a means of doing so—the process takes a remotely sensed image and creates a new NDVI image from it, containing values related to the relative health of the vegetation in the image. As long as the sensor can measure the red and near-infrared portions of the electromagnetic spectrum, NDVI can be calculated.
336
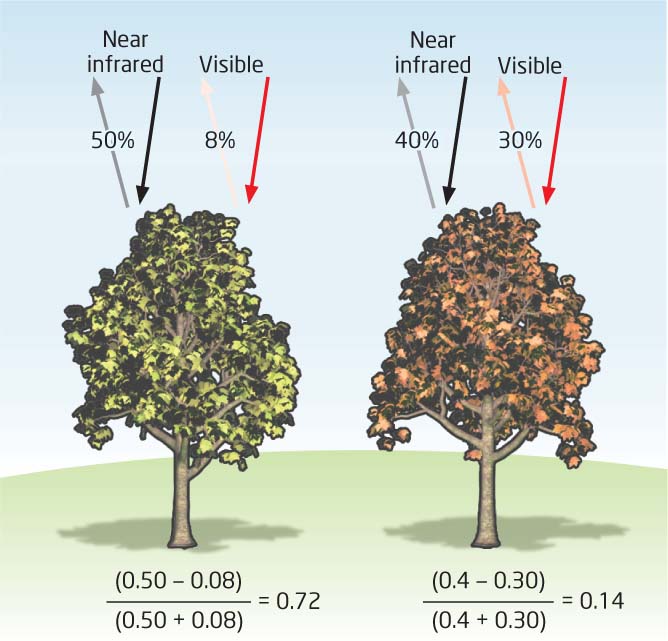
NDVI is computed using the measurements for the red and near-infrared bands. The formula for NDVI is:

NDVI returns a value between −1 and +1—the higher the value (closer to 1), the healthier the vegetation is at the area being measured. Low values indicate unhealthy vegetation or a lack of biomass. Very low or negative values indicate areas where nothing is growing (like pavement, clouds, or ice). Figure 10.6 shows an example of NDVI being calculated for both a healthy vegetation source (one that reflects a high amount of near-infrared energy and less red energy), resulting in a high NDVI value (0.72) and an unhealthy source (which reflects less near-infrared energy and more red energy), which results in a lower NDVI value (0.14).
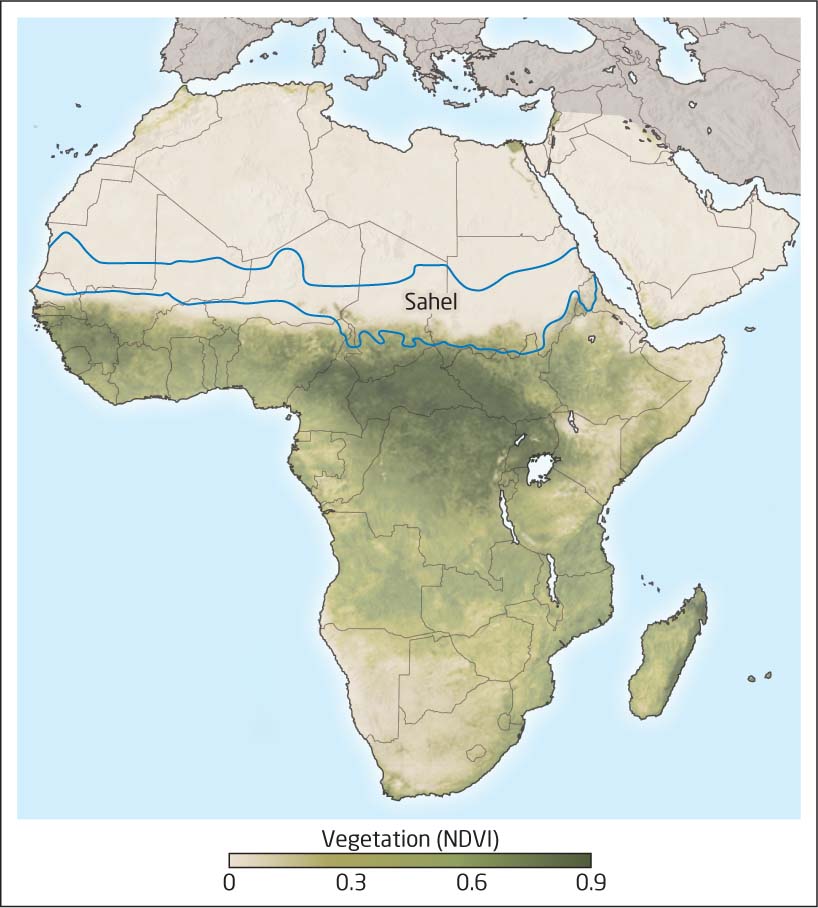
NDVI can be calculated by a variety of remote sensing devices, so long as their sensors can measure the red and near-infrared bands (which several of the specific sensors discussed in the next two chapters can do). NDVI gives a quick means of assessing the health of various forms of vegetation, and is used in a variety of environmental applications, both local and global—from crop monitoring to surveying the planet’s natural resources (see Figure 10.7 for an example and Hands-on Application 10.2: Examining NDVI with NASA ICE to use some remotely sensed imagery to examine the health of a rain forest).
337
338
 HANDS-ON APPLICATION 10.2
Examining NDVI with NASA ICE
NASA (the National Aeronautics and Space Administration) has an online tool called ICE (Image Composite Explorer) that allows users to analyze different applications of remotely sensed data, and one component of ICE features an interactive NDVI tool. To use ICE’s NDVI exercise, open your Web browser and go to http://earthobservatory.nasa.gov/Experiments/ICE/panama/panama_ex2.php. This section of ICE is part of a larger exercise designed to examine the health of tropical rain forests. The tools will allow you to build NDVI images using the near-infrared and red bands of a Landsat satellite image. To see the NDVI imagery fully, select channel 4 (this is the near-infrared band) in the pull-down menu next to the red Channel 1 text and then select channel 3 (this is the red band) in the pull-down menu next to the green Channel 2 text. Click Build and you can view the NDVI image of the area. Change the color table and zoom around the imagery.
Expansion Questions:

Question
How can NDVI be used to measure the health of the rain forests?
-
Question
In the NDVI image, what do the very dark areas represent? What do the very light areas represent?