10.5 
How Do You Display a Digital Remotely Sensed Image?
spatial resolution the size of the area on the ground being represented by one pixel’s worth of energy measurement.
Once the digital data is collected, the next step is to transform it into something that can be viewed on a computer screen, especially since many of these bands of energy are only visible to the sensor and not to the human eye. Sensors can only “see” a certain area of the ground at a time and will record measurements within that particular area. The size of this area on the ground is the sensor’s spatial resolution: it’s the smallest unit of area the sensor can collect information about. If a sensor’s spatial resolution is 30 meters, each measurement will consist of a 30 meter × 30 meter area of ground, and the sensor will measure thousands of these 30 meter × 30 meter sections at once. No matter how many sections are being measured, the smallest area the sensor has information for is a block that is 30 meters × 30 meters. Keep in mind, the spatial resolution of the image is going to limit the kind of visual information you can obtain from it. In an image with 4-meter resolution, you may be able to discern that an object is a large vehicle, but you won’t be able to go into any details about it. An image with 0.5-meter resolution, however, will contain much more detailed information about the vehicle.
brightness values the energy measured at a single pixel according to a predetermined scale; also referred to as Digital Numbers (DNs)
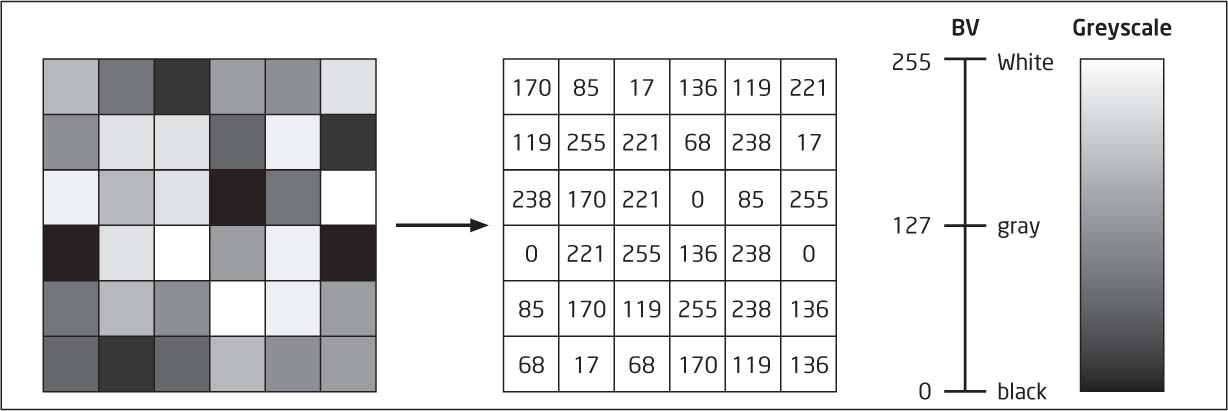
We’ll discuss more about spatial resolution in Chapter 11, but for now, each one of these blocks of the ground being sensed represents the size of the area on the ground having its energy reflection being measured by the sensor. Owing to the effects of the atmosphere, there’s not a straight one-to-one relationship between the reflectance of energy and the radiance being measured at the satellite’s sensor. The energy measurements at the sensor are converted to a series of pixels, with each pixel receiving a brightness value, or BV (also referred to as a Digital Number, or DN), for the amount of radiance being measured at the sensor for that section of the ground. This measurement is made for each wavelength band being sensed.
339
Brightness values are scaled to fit a range specified by the sensor. We’ll discuss these ranges in more detail in Chapter 11 (with regard to a sensor’s radiometric resolution), but for now, the scale of values in a range represents the energy being recorded—from a low number (indicating very little radiance) to a high number (indicating a lot of radiance)—and measured as a number of bits. For instance, an 8-bit sensor will scale measurement values between 0 (the lowest value) and 255 (the highest value). These values represent the energy being recorded in a range from 0 to 255 (these values are related to the amount of energy being measured). For instance, all values in a band of an image could possibly only be in a range such as 50 to 150, with nothing reaching the maximum value of 255.
8-bit imagery a digital image that carries a range of brightness values from 0 to 255
Each wavelength band that is being sensed is assigned a BV in this range for each pixel in the image. Brightness values (BVs) can be translated to a grayscale to be viewed on a computer screen. With the range of values associated with 8-bit imagery, values of 0 represent the color black and values of 255 represent the color white. All other integer values between 0 and 255 are displayed in shades of gray, with lower numbers being darker shades and higher numbers being lighter shades. In this way, any of the wavelength band measurements (including the wavelengths normally invisible to the human eye) can be displayed in grayscale on a computer screen (see Figure 10.8). For instance, a near-infrared image will have the brightness value for each pixel representing the near-infrared measurements at the sensor for that area.
panchromatic imagery black and white imagery formed by viewing the entire visible portion of the electromagnetic spectrum
multispectral imagery remotely sensed imagery created from the bands collected by a sensor capable of sensing several bands of energy at once
hyperspectral imagery remotely sensed imagery created from the bands collected by a sensor capable of sensing hundreds of bands of energy at once
color gun equipment used to display a color pixel on a screen through the use of the colors red, green, and blue
color composite an image formed by placing a band of imagery into each of the three color guns (red, green, and blue) to view an image in color rather than gray scale
If a sensor is measuring the visible portion of the spectrum and treating the entire 0.4- to 0.7-micrometer range as if it were one band, the result will be black-and-white panchromatic imagery. However, remote sensing devices are capable of sensing several wavelengths of the electromagnetic spectrum simultaneously. Some widely used remote sensing devices can sense several different bands at once—U.S. government satellite sensors are often capable of sensing 7, 10, or even 36 bands at the same time. Imagery created by sensing multiple bands together is referred to as multispectral imagery. Some technology can simultaneously sense over 200 bands of the electromagnetic spectrum, producing hyperspectral imagery.
340
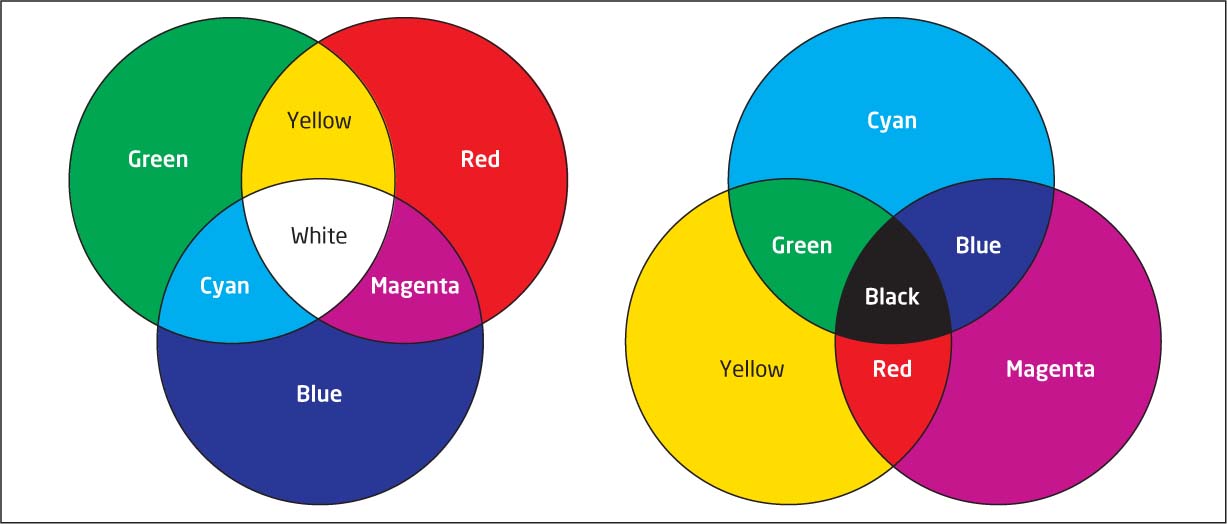
When multiple bands of imagery are available, they can be combined so that the image may be viewed in color, rather than grayscale. Displaying imagery in color requires three bands to be displayed simultaneously, each shown in a separate color other than gray. This is simplifying the technical aspects a bit, but a display monitor (like a computer screen) is equipped with devices that can draw a pixel on the screen in varying degrees of red, green, and blue. These are often referred to in remote sensing as color guns (a name that refers back to equipment in old CRT monitors and tube televisions for displaying colors in red, green, and blue). If an 8-bit image is drawn using the red color gun, the values of 0 to 255 will not be in a range of black, gray, and white, but instead will be in a range of the darkest red, medium red, and very bright red. The same goes for the blue and green color guns—each gun is able to display an image in its respective color on a range of 0 to 255.
A color composite can be generated by displaying the brightness values of one band of imagery in the red gun, a second band of imagery in the green gun, and a third band of imagery in the blue gun. Each pixel will then be drawn using brightness values as the intensity of the displayed color. For instance, a pixel can be displayed using a value of 220 in the red gun, 128 in the green gun, and 75 in the blue gun, and the resulting color shown on the screen will be a combination of these three color intensities. By using the three primary colors of red, green, and blue, and combining them to varying degrees using the range of values from 0 to 255, many other colors can be created (using the 256 numbers in the 0–255 range, with three colors, there are 16,777,216 possible color combinations) to be displayed on the screen (see Figure 10.9 for examples of color formation).
341
To create colors, different values can be assigned to the red, green, and blue guns. Table 10.1 shows some examples of ways to combine values together to form other colors (keeping in mind that there are millions of possible combinations of these values). See also Hands-on Application 10.3: Color Tools Online: Color Mixing for an online tool that can be used to create colors from various 0 to 255 values.
| Red Value | Green Value | Blue Value | Color Formed |
|---|---|---|---|
| 255 | 255 | 0 | Yellow |
| 255 | 0 | 255 | Magenta |
| 0 | 255 | 255 | Cyan |
| 255 | 128 | 0 | Orange |
| 0 | 64 | 128 | Dark Blue |
| 255 | 190 | 190 | Pink |
| 255 | 255 | 115 | Bright Yellow |
| 115 | 76 | 0 | Brown |
| 0 | 197 | 255 | Sky Blue |
| 128 | 128 | 128 | Gray |
| 255 | 255 | 255 | White |
| 0 | 0 | 0 | Black |
 HANDS-ON APPLICATION 10.3
Color Tools Online: Color Mixing
The Color Tools Website provides several great resources related to color. The Color Mixer tool available here: http://www.colortools.net/color_mixer.html allows you to input values (between 0–255) for red, green, and blue, and to see the results. On the Website, type a value into the box in front of the “/255” for each of the three colors and check out the result. Try the values listed in Table 10.1, and try mixing some values of your own, to see how different numbers create different colors.
Expansion Questions:

Question
What colors do the following combinations generate? (Try to figure out the result first, then use the Color Mixer to verify your results.)
- R: 0, G: 128, B: 255
- R: 175, G: 175, B: 175
- R: 85, G: 85, B: 128
- R: 20, G: 100, B: 50
- R: 120, G: 90, B: 10
342
When an image is examined, the color being displayed for each pixel corresponds to particular values of red, green, and blue being shown on the screen. For a remotely sensed image, those numbers are the brightness values of the band being displayed with that color gun. Any of the bands of an image may be displayed with any of the guns, but as there are only three color guns, only three bands can be displayed as a color composite at any time (Figure 10.10).
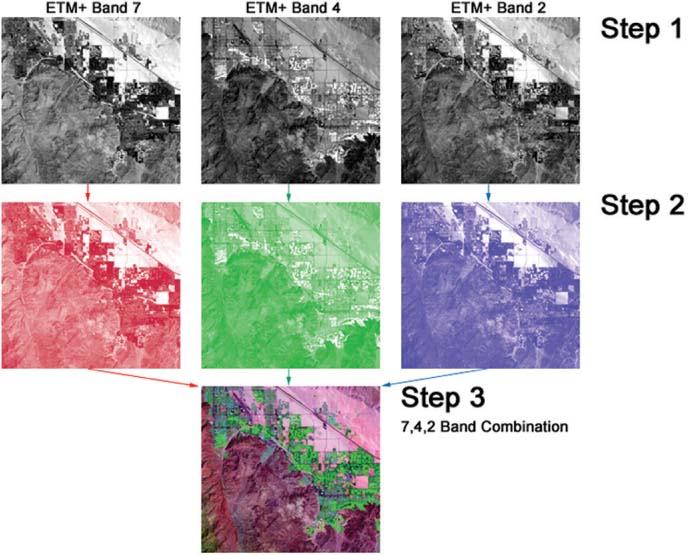
For example, the near-infrared band values could be displayed using the red color gun, the green band values could be displayed using the green color gun, and the red band values could be displayed using the blue color gun. Using this arrangement, a brown pixel can be seen on the screen. On closer examination, it’s discovered that the red gun (which has the near-infrared band) has a value of 150, the green gun (which has the green band) has a value of 80, and the blue gun (which has the red band) has a value of 20. These values correspond to the brightness values of their respective bands and combine together to form that pixel color. If you change the arrangement of bands and guns, you’ll see different colors displayed on the screen, but the actual brightness values will not change. Table 10.2 shows how the display color will change depending on which band is being displayed with which gun.
| Red Value | Green Value | Blue Value | Color Formed |
|---|---|---|---|
| NIR Band (150) | Green Band (80) | Red Band (20) | Brown |
| Red Band (20) | Green Band (80) | NIR Band (150) | Deep Blue |
| Green Band (80) | NIR Band (150) | Red Band (20) | Green |
| Red Band (20) | NIR Band (150) | Green Band (80) | Paler Green |
Note that while the pixel being displayed on the screen will change color depending on what band is being displayed with a different gun, none of the brightness values of that pixel will be altered. Different band combinations can reveal different information about objects in an image due to the varying brightness values of the bands for those items.
343
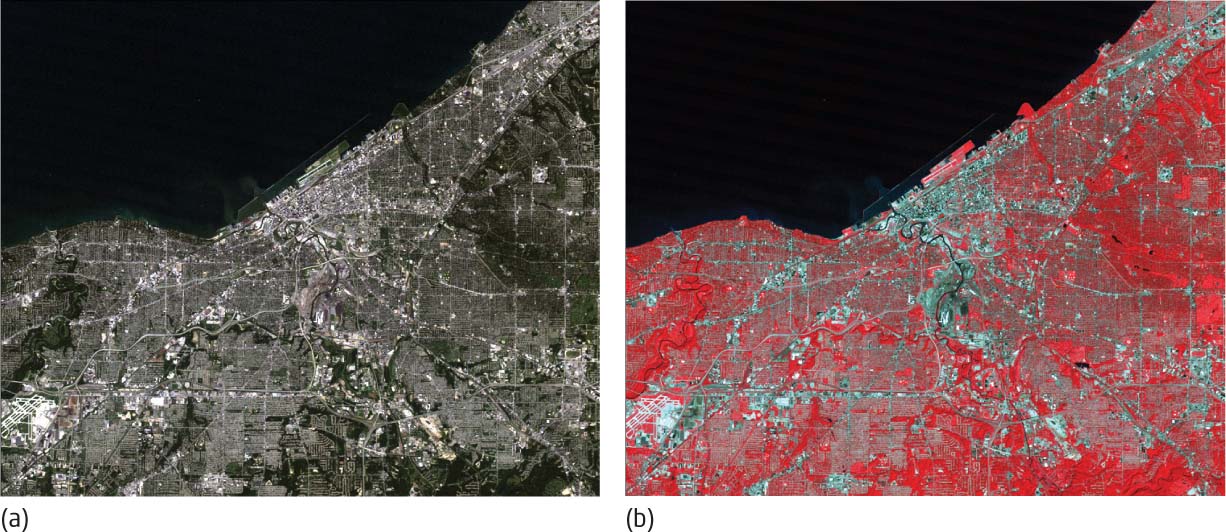
true color composite an image arranged by placing the red band in the red color gun, the green band in the green color gun, and the blue band in the blue color gun
false color composite an image arranged when the distribution of bands differs from placing the red band in the red color gun, the green band in the green color gun, and the blue band in the blue color gun
Several different types of composites can be formed using the various bands and guns. Whenever a composite has the red band displayed in the red gun, the green band displayed in the green gun, and the blue band displayed in the blue gun (the way natural colors would be shown), a true color composite is formed. A true color composite appears as you would expect a remotely sensed image to appear if you were looking down at the ground from an airplane (that is, the trees would be green and the water would be blue). Whenever the distribution of bands to guns deviates from this arrangement (some other combination is used besides the true color one), a false color composite is generated. For instance, all four of the combinations described in Table 10.2 would result in false color composites as none of them display the red band in the red gun, the green band in the green gun, and the blue band in the blue gun. See Figure 10.11 for a comparison of true color and false color composites.
344
standard false color composite an image arranged by placing the near-infrared band in the red color gun, the red band in the green color gun, and the green band in the blue color gun
With all of these different combinations possible, there is a standard false color composite that is used in many remote sensing studies. In this standard false color arrangement, the near-infrared band is displayed in the red gun, the red band is displayed in the green gun, and the green band is displayed in the blue gun. The false color composite image is similar to the CIR photos discussed back in Chapter 9. Objects that have a strong reflection of near-infrared energy (like healthy plants, grass, or other green vegetation) appear in a variety of bright reds, while water (which has very little reflection of the near-infrared, red, and green energy) appears as black. With composites, multispectral imagery can be displayed in color, regardless of what bands are being used, and these composites can be used for many different types of image analysis (see Hands-on Application 10.4: Comparing True Color and False Color Composites for an online method of comparing how objects on the ground are shown in true color and false color composites).
HANDS-ON APPLICATION 10.4
Comparing True Color and False Color Composites
An excellent online resource for examining Landsat imagery in different band combinations from different dates is the Esri ChangeMatters tool. Open your Web browser and go to http://changematters.esri.com/compare to get started. ChangeMatters will show you three remotely sensed images—two Landsat images from different dates and then an NDVI comparison of the two. By default, the initial images should be those of Mount St. Helens (from 1975, 2000, and an NDVI change between the two dates).
Start by selecting the dates 2005–2010 from the Select Dates pull-down menu (if a warning message appears, just close it and continue). This will change the first image to an image from a 2005 date and the second image to that taken from a 2010 date. Next, choose the option for Natural Color from the Select Image Map pull-down menu. This will change both the 2005 and 2010 images to true color composites (note that the colors may be a little different in each one). You can zoom in on one of the two images to examine some of the landscape features (such as Spirit Lake, the volcano itself, or the vegetated areas surrounding it) and all three images will zoom to the same extent. To examine the same area in a false color composite, choose the option for Infrared from the Select Image Map pull-down menu. Check out the same features in a false color arrangement to see how they appear differently.
In the Search box, you can type the name of a location (such as Cleveland, Ohio) and the images will switch to Landsat images from 2005 and 2010 (and the NDVI change comparison) of Cleveland. Take a close look at the urban areas of Cleveland and the surrounding non-urban areas, as well as Lake Erie in both the Natural Color and Infrared settings. In addition, use the Search box to view your own local area and examine it on both Natural Color and Infrared imagery from the two dates.
Expansion Questions:
-
Question
How did all the features change in appearance (from Mount St. Helens and your own local area) when you switched from the true color composite (Natural Color) to the false color composite (Infrared), and why?
-
Question
Check out the parts of Cleveland, Ohio around Lake Erie, both rural and urban. How do the lake and areas around the lake appear in true color and false color composites, and why?
345