11.3 
What Is a Landsat Satellite and What Does It Do?
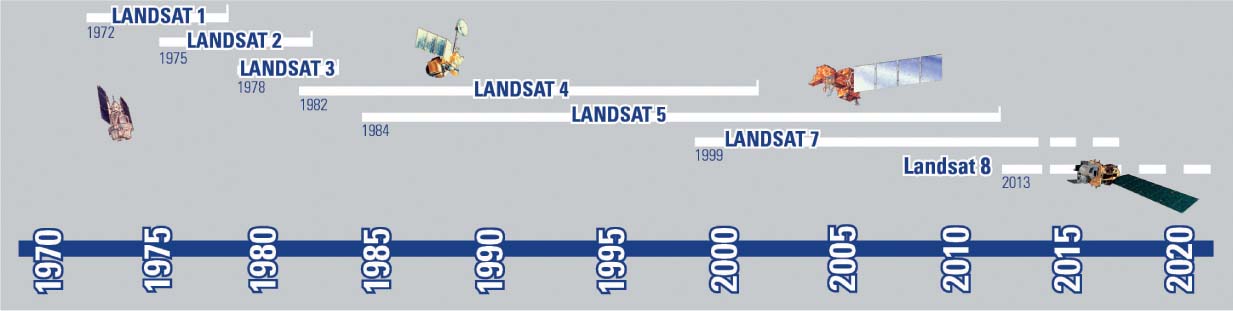
Landsat a long-running and ongoing U.S. remote sensing project that launched its first satellite in 1972
MSS the Multispectral Scanner aboard Landsat 1 through 5
multispectral sensor a sensor that can measure multiple wavelength bands simultaneously
TM the Thematic Mapper sensor onboard Landsat 4 and 5
This chapter and Chapter 10 have mentioned a satellite system called Landsat but haven’t really explained what it is, how it operates, or why it’s so important. What would eventually become the U.S. Landsat program was conceived in the late 1960s as a resource for doing remote sensing of Earth from space. The program’s first satellite, Landsat 1, was launched in 1972 (see Figure 11.7 for a graphical timeline of Landsat launches). Landsat 1’s sensor was the Landsat MSS (Multispectral Scanner), which had a temporal resolution of 18 days. The MSS would continue to be part of the Landsat missions through Landsat 5. Landsat 4 and 5’s MSS was capable of sensing four bands (red, green, plus two bands in the near infrared) at 79-meter spatial resolution and 6-bit radiometric resolution. As the name implies, MSS is an example of a multispectral sensor, which can measure multiple wavelengths at once.
Landsats 4 and 5 were also equipped with a new remote sensing device called the TM (Thematic Mapper). The TM was also a multispectral sensor that allowed for sensing in seven bands in the electromagnetic spectrum simultaneously, as follows:
 Band 1: Blue (0.45 to 0.52 micrometers)
- Band 2: Green (0.52 to 0.60 micrometers)
- Band 3: Red (0.63 to 0.69 micrometers)
- Band 4: Near infrared (0.76 to 0.90 micrometers)
- Band 5: Middle infrared (1.55 to 1.75 micrometers)
- Band 6: Thermal infrared (10.4 to 12.5 micrometers)
- Band 7: Middle infrared (2.08 to 2.35 micrometers)
These bands were chosen for TM because they were key to a variety of studies. Bands 3 and 4 were used to monitor vegetation (and also to examine NDVI, as discussed in Chapter 10). Band 5 was useful when examining the water content of plants, while band 7 was useful in distinguishing various rock and mineral types. The thermal band 6 enabled the monitoring of heat energy in a variety of settings. The TM bands had improved radiometric resolution over MSS of 8 bits while the spatial resolution of bands 1–5 and 7 was improved to 30 meters (band 6 had a spatial resolution of 120 meters) and had a swath width of 185 kilometers. TM also had an improved temporal resolution of 16 days.
365
Landsat 5 the fifth Landsat mission, launched in 1984, which carried both the TM and MSS sensors
Landsat 4 was launched in 1982 and ended its mission in 1993. Landsat 5 was launched in 1984, and it continued sensing and transmitting viable data to Earth until it ended its mission in 2012 before finally being shut down in 2013. Landsat 5’s mission lasted for 28 years, so it should raise some curiosity that it was relied upon so heavily, given the importance of Landsat in remote sensing. Landsat 5 was not likely intended to be the cornerstone of the program, but that’s what it became. Landsat 6 was intended to replace it, but when it was launched in 1993, it failed to achieve Earth orbit and was lost, whereas Landsat 5 lived on for another 19 years.
Landsat 7 the seventh Landsat mission, launched in 1999, which carries the ETM+ sensor
ETM+ the Enhanced Thematic Mapper sensor onboard Landsat 7
Landsat 7, launched in 1999, carried neither the MSS or the TM; instead, it carried a new sensor called the ETM+ (Enhanced Thematic Mapper Plus). This new device senses the same seven bands as TM at the same swath width as well as the same radiometric and spatial resolutions (although the thermal band 6’s spatial resolution was improved to 60 meters). It also added a new eighth band—a panchromatic one with a spatial resolution of 15 meters. With this improved spatial resolution, the panchromatic band could be used to pan-sharpen the quality of the other imagery. Landsat 7’s temporal resolution was still 16 days, but it could acquire about 250 images per day. See Figure 11.8 for an example of Landsat 7 imagery and Hands-on Application 11.3: Streaming Landsat Imagery for some examples of recent imagery collected by Landsat.
SLC the Scan Line Corrector in the ETM+ sensor. Its failure in 2003 caused Landsat 7 ETM+ imagery to not contain all data from a scene
In 2003, Landsat 7’s SLC (Scan Line Corrector) failed and could not be repaired. Because of the malfunctioning SLC, the ETM+ produces imagery that’s missing certain data. Without a working SLC, an ETM+ image contains only about 75% of the data that should be there. ETM+ fills in the gaps by substituting pixels from other Landsat 7 scenes of the same area taken on a different date, as well as by other methods. With these types of issues emerging in Landsat 7, some researchers continued to use Landsat 5 as their source of remotely sensed Landsat data. However, with Landsat 5 having operated years beyond its mission life (and finally shut down) and with Landsat 7 having issues with collecting imagery due to the SLC failure, the future of the Landsat program must be in question, since there has been only one Landsat launch since 1999.
366
 HANDS-ON APPLICATION 11.3
Streaming Landsat Imagery
For a dynamic look at streaming Landsat imagery, the EarthNow! Website (sponsored by the U.S. Geological Survey, the USGS, and available online at http://earthnow.usgs.gov) is a great tool (use of EarthNow! requires you to have Java loaded on your computer, so make sure it’s compatible with the version of Java that you have). EarthNow! shows recent Landsat imagery (usually from today’s date)—a small map on the screen will show the position and orbit of the Landsat satellite that acquired the imagery. The main EarthNow! window will show the imagery collected by Landsat (with attached labels added by those who processed the data).
Expansion Questions:
-
Question
What is the current position of Landsat 7, and how much area on the ground is it currently imaging?
-
Question
As you watch the Landsat 7 imagery being streamed to you, you may see several areas covered by clouds. If you need Landsat 7 imagery from these locations, what do you have to do?
367
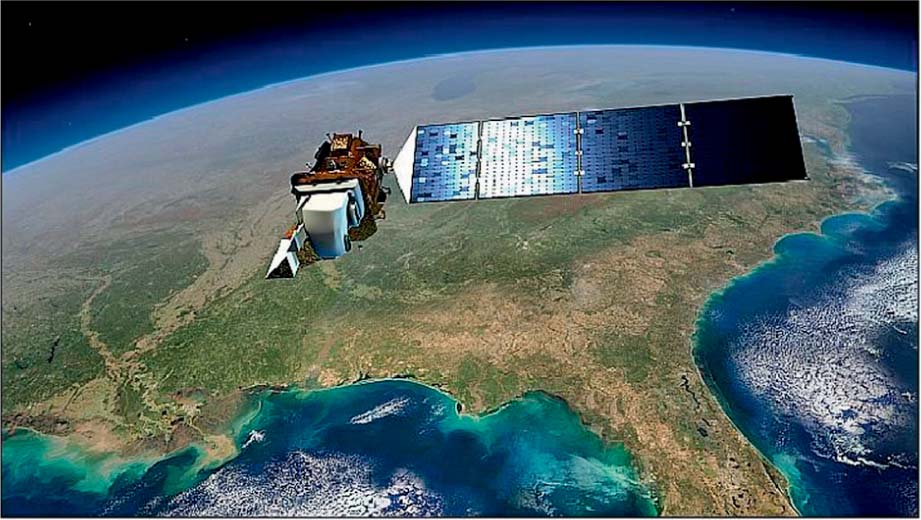
Landsat 8 the latest Landsat mission, launched in 2013
LDCM the Landsat Data Continuity Mission—an alternate name for the Landsat 8 mission
OLI the Operational Land Imager, the multispectral sensor onboard Landsat 8
TIRS the Thermal InfraRed Sensor, the instrument that acquires thermal imagery onboard Landsat 8
Landsat scene a single image obtained by a Landsat satellite sensor
Worldwide Reference System the global system of Paths and Rows that is used to identify what area on Earth’s surface is present in which Landsat scene
The latest Landsat mission is Landsat 8 (also known as the Landsat Data Continuity Mission, LDCM) launched on February 11, 2013 (Figure 11.9). Landsat 8’s sensor is the next iteration of Landsat technology, called the OLI (Operational Land Imager), which has capabilities similar to ETM+. OLI senses visible and infrared bands similar to ETM+ at 30-meter resolution, a panchromatic band at 15-meter resolution, and two new 30-meter bands aimed at monitoring clouds and coastal zones. A thermal band is not part of OLI; but instead, a separate instrument on the satellite, called TIRS (the Thermal InfraRed Sensor), will collect two bands of thermal data at 100-meter resolution. It’s estimated that Landsat 8 will collect about 400 images per day, with both instruments covering a 185-kilometer swath. There’s a strong, ongoing need for Landsat imagery that monitors large-scale phenomena, such as environmental effects of land-use changes as well as urban expansion. Long-term gaps in available current data and between the dates of imagery would have a huge negative impact on these types of studies.
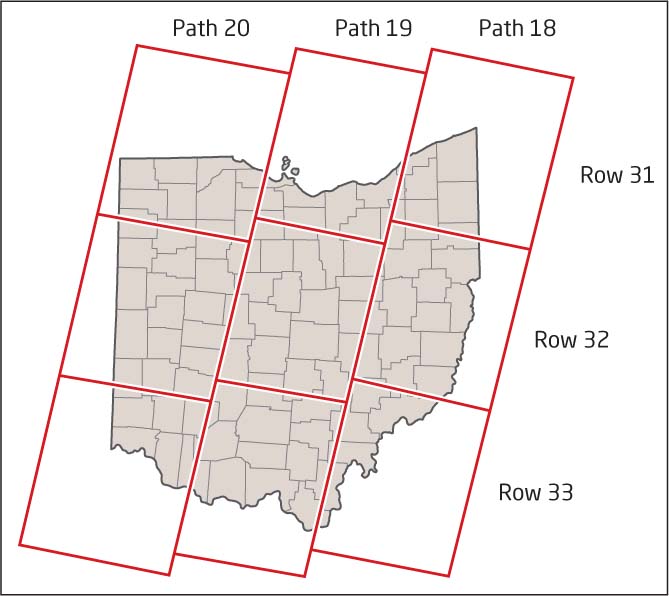
Each Landsat scene measures an area about 170 kilometers long by 183 kilometers wide (for the TM and ETM+ sensors) and is considered a separate image. At this size, it takes several images just to cover one state. Thus, if you want access to imagery of a particular area, you need to know which scene that ground location is in. Landsat uses a Worldwide Reference System that divides the entire globe into a series of Paths (columns) and Rows. For instance, imagery of Columbus, Ohio, extends from the scene at Path 19, Row 32, while imagery of Toledo would be found in Path 20, Row 31 (Figure 11.10). At an area of 170 kilometers long by 183 kilometers wide, a scene will often be much larger than the area of interest—for example, Path 19, Row 32 contains much more than just Columbus; it encompasses the entire middle section of the state of Ohio, so to examine only Columbus, you would have to work with a subset of the image that matches the city’s boundaries. Also, an area of interest may sometimes straddle two Landsat scenes—for instance, Mahoning County in Ohio is entirely located in Path 18, but part of the county is in Row 31 and part of it is in Row 32. In this case, both images would need to be merged together and then have the boundaries of the county used to define the subsetted area.
368
 THINKING CRITICALLY WITH
GEOSPATIAL TECHNOLOGY 11.2
What If There Is No Landsat 9?
The Landsat Program is the longest running remote sensing program in existence. It has been providing global coverage since 1972. However, with Landsat 5’s TM sensor shut down since 2012, the U.S. remote sensing mission currently relies on the Landsat 7 satellite (launched in 1999 and now impaired due to the SLC error) and also on Landsat 8, which was launched in February 2013. Despite Landsat 5’s successful 28-year tenure, the satellite missions are not intended to last for that long—Landsat 7’s mission is only expected to last until about 2016. It takes several years to develop, build, and launch a Landsat satellite, and the current status of Landsat 9 is questionable—as of the summer of 2013, no construction has begun for Landsat 9. Since there was a 14-year gap between the launches of Landsats 7 and 8, what might happen to data acquisition if there is a similar lengthy stretch of time between the launchings of Landsat 8 and Landsat 9 (or if Landsat 9 is unfunded and unbuilt)? This may sound like a doomsday scenario, but if Landsat 8 develops unfixable problems as Landsat 7 did or if the satellites somehow become unavailable for imagery acquisition, then what happens? Will the United States have to purchase imagery from other sources or countries to make up the data gap until another Landsat mission can be launched? Are there other sources that the U.S. government could use to make up for the lack of Landsat imagery? What impact would a lack of continuous Landsat imagery have on the numerous applications and studies previously described?
369
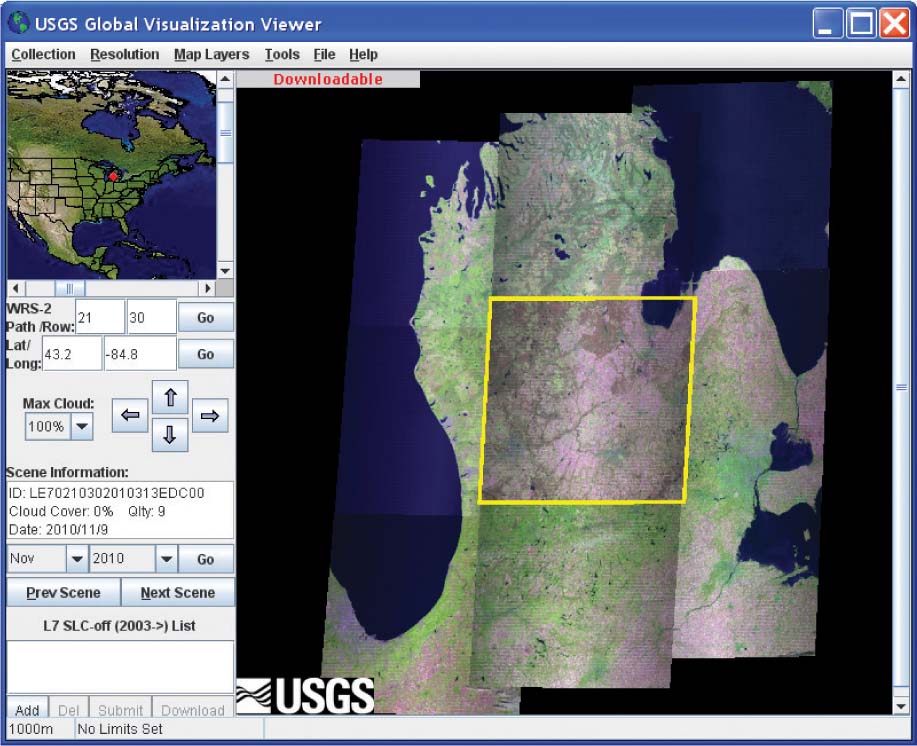
GloVis the Global Visualization Viewer set up by the USGS for viewing and downloading satellite imagery
There’s been a growing trend to make Landsat scenes freely available to the public. Thanks in part to the activities of groups such as OhioView and AmericaView (see Chapter 15), a lot of Landsat imagery is freely available for distribution over the Internet. The USGS maintains an online utility called GloVis (Global Visualization Viewer), which is used to distribute Landsat (and other satellite) imagery across the Internet (see Figure 11.11 and Hands-on Application 11.4: Viewing Landsat Imagery with GloVis and LandsatLook). In 2008, the USGS announced that the entire Landsat 7 archive of imagery, plus the available data from Landsats 1 through 5, would be made freely available and distributed via GloVis (and now Landsat imagery is also available through another online resource called LandsatLook). This decision allows free worldwide access to a vast library of remote sensing data for everyone, and this availability of the data can only help with furthering research and education in remote sensing.
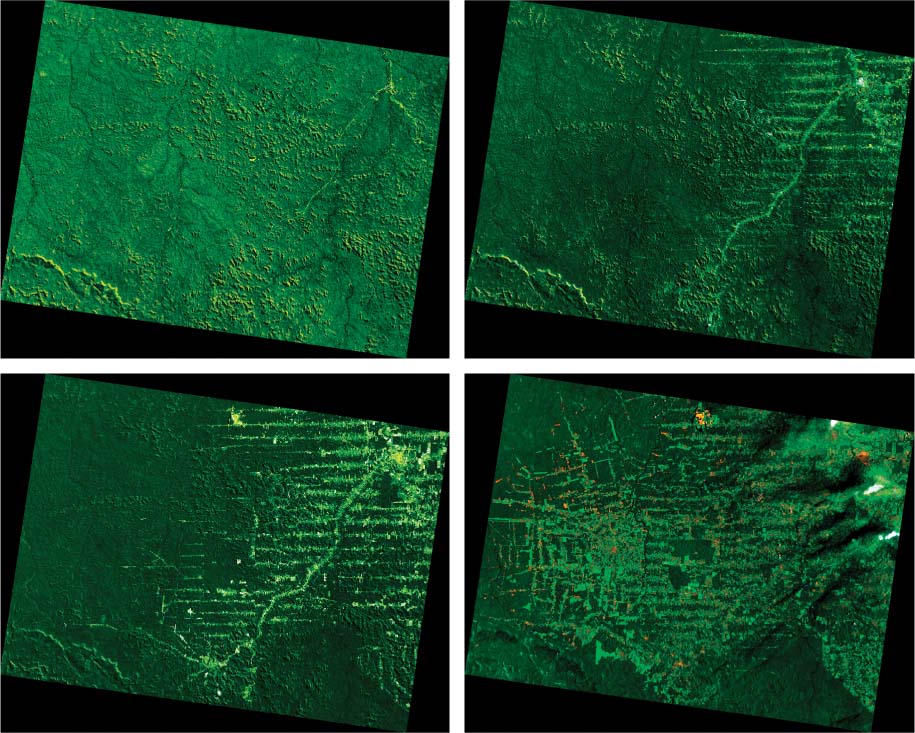
Being able to monitor large-scale conditions on Earth on a regular basis (at 30-meter resolution) with a variety of multispectral bands (including near-infrared, middle-infrared, and thermal characteristics) will provide a rich dataset for numerous applications. With Landsat imagery stretching back for more than 40 years and providing a constant source of observations, long-term tracking of environmental phenomena (such as ongoing land-use or land-cover changes over a particular area) can be performed. For instance, the growth of urban areas over time can be observed every 16 days (cloud cover permitting, of course), enabling planners to determine the spatial dimensions of new developments across a region. Figure 11.12 shows an example of utilizing Landsat imagery over time to track the patterns of deforestation in Brazil through examination of clear-cut areas and new urban areas built up in the forest. The color composite images show the rain forest in dark green shades, while the deep-cut patterns of forest clearing are clearly visible and the encroachment of development into the forest can be tracked and measured over time.
370
HANDS-ON APPLICATION 11.4
Viewing Landsat Imagery with GloVis and LandsatLook
With GloVis, Landsat imagery from multiple dates (and multiple sensors) can be viewed, examined (for the amount of cloud cover and the available imagery dates), and downloaded for use by a GIS or an image processing or viewing software package. To use GloVis, open your Web browser and go to http://glovis.usgs.gov—also make sure that you have Java installed on your machine and your browser will allow for a pop-up window from this Website. Either select a location from the map or enter latitude/longitude coordinates for a place. The Landsat scenes for the area will appear in a separate window, allowing you to select imagery by a specific path and row, obtain information about the scene (such as the percentage of cloud cover), and choose available imagery from different sensors. If the word “downloadable” appears in red in the upper-left-hand corner of the image, the raw band data for that Landsat scene can be obtained directly via GloVis. You’ll also see that several other satellites and sensors have imagery available that can be viewed via GloVis.
The USGS has a second utility for viewing and downloading Landsat imagery called the LandsatLook Viewer, available at http://landsatlook.usgs.gov. In the search box, type the name of the area you want to view Landsat imagery for and the Viewer will zoom to that location. Next, click on Select Scenes, and LandsatLook will assemble all available images for that location. Using the Time tools, you can slide the bar to view imagery of a specific date or use the arrows to advance between images. You can also adjust the transparency of the Landsat images to see how they match up with the base map. Under the Advanced Query options you can limit what dates you want to view, the maximum percentage of cloud cover that an image could have to be displayed, as well as which sensors the images are obtained from. By clicking on the Table button, you can obtain further information about each scene and also options for downloading the raw data for the scenes (by adding them to a download cart).
Expansion Questions:
-
Question
What Path and Row is your local area located in? What Landsat imagery is available via GloVis for that Path/Row combination?
-
Question
How many Landsat images are available for your local area through LandsatLook? Are there any large-scale land-cover changes that you can see over time by viewing imagery from past years and current years for your local area?
Beyond examining land-cover changes over time, the multispectral capabilities of Landsat imagery can be used for everything from measuring drought conditions and their effects on crops, to glacier features, to the aftermath of natural disasters. By examining the different band combinations provided by Landsat imagery, scientists can find clues to understanding the spread of phytoplankton in coastal waters, enabling environmentalists to try and head off potential algae blooms or red-tide conditions. Threats to animal habitats can be assessed through forest and wetland monitoring via Landsat imagery. Landsat images also allow scientists to track the movements of invasive species that threaten timber industries. Hands-on Application 11.5: Applications of Landsat Imagery lets you dig further into the myriad uses of Landsat remote sensing.
371
EO-1 a satellite launched in 2000 as part of NASA’s New Millennium Program, which is set to orbit 1 minute behind Landsat 7
ALI the multispectral sensor onboard EO-1
Hyperion the hyperspectral sensor onboard EO-1
hyperspectral sensor a sensor that can measure hundreds of different wavelength bands simultaneously
NASA also operates a remote sensing project with capabilities related to the Landsat program. EO-1 (Earth Observing 1) was launched in 2000 as part of NASA’s New Millennium Program and placed in orbit so it was traveling right behind Landsat 7 (within 1 minute). EO-1 features a multispectral sensor called ALI (Advanced Land Imager) that is similar to ETM+ but can image 10 different bands in a 37-kilometer swath width at 30-meter resolution (along with a 10-meter panchromatic band). ALI was also used to test and validate sensor technology planned for use in Landsat 8. EO-1 also carries Hyperion, a sensor that detects 220 bands at 30-meter resolution in a smaller swath width of 7.7 kilometers. Hyperion is an example of a hyperspectral sensor, which can measure hundreds of wavelengths simultaneously.
Although Landsat data has been widely used for numerous environmental studies, 30-meter resolution isn’t nearly enough to do very detailed, high-resolution studies. At 30-meter resolution, broad land-use change modeling and studies can be performed, but a much finer spatial resolution would be required to pick out individual details in an image. High-resolution sensors have a different purpose than Landsat imagery—with a very fine spatial resolution, crisp details can emerge from a scene. Spy satellites or military surveillance satellites require this type of finer spatial resolution, but of course the imagery they acquire remains classified. Much of the nonclassified and available high-resolution satellite imagery is obtained and distributed commercially rather than from government sources.
372
HANDS-ON APPLICATION 11.5
Applications of Landsat Imagery
Landsat imagery has been adopted for numerous environmental monitoring, measuring, and tracking applications. An excellent example of Landsat applications can be seen online at http://world.time.com/timelapse. The Website shows various places around Earth (such as Las Vegas, Dubai, or the Columbia Glacier) in a series of Landsat images between 1984 and 2012. You can also select the Explore the World option to type a location and see time-lapse Landsat imagery of that place from the last several years. As you scroll down on the Web page, you’ll see further discussion of the applications of Landsat imagery (on topics such as climate change or urban growth) as well as several videos showcasing these topics as well.
To investigate these uses further, go to http://landsat.gsfc.nasa.gov/about/appl_matrix.html. This Website, maintained by NASA, highlights several different categories of Landsat imagery applications, including Agricultural, Coastal, Geologic, Hydrologic, Mapping, and Environmental Uses. Select one of the categories of interest to you or related to your own field, and explore some of the case studies and applications presented in that column.
Expansion Questions:
-
Question
How is Landsat imagery being applied in your field of choice?
-
Question
How does the long-term consistent use of multispectral imagery from Landsat lend itself to these kinds of applications?