12.4 
How Can EOS Applications Be Easily Viewed and Analyzed?
Visible Earth a Website operated by NASA to distribute EOS images and animations of EOS satellites or datasets
Blue Marble a composite MODIS image of the entire Earth from space
With all of this EOS data and imagery collected on a near-daily basis, you might expect there would be a mechanism to get this information out into the hands of the public. Much of the available EOS data is processed and compiled into a series of data products rather than as raw imagery or values. NASA has a number of Web-based platforms in place to distribute these products (as well as EOS imagery) so that they can be viewed or analyzed. One of these, Visible Earth (used in Hands-on Applications 12.3 and 12.4), is a NASA-operated Website from which you can download pictures and animations related to EOS missions (online at: http://visibleearth.nasa.gov). However, the pictures are just that—graphics of the processed data that show images from EOS instruments. The graphics come with detailed descriptions of the scientific event being shown (such as the hole in the ozone layer over Antarctica, as measured by OMI, or global sea surface temperatures, as measured by AMSR-E). Visible Earth also features popular detailed composite images such as NASA’s Blue Marble (showing the entire Earth from space) and also Earth’s city lights by night.
400
NASA Earth Observatory a Website operated by NASA that details how EOS is utilized in conjunction with numerous global environmental issues and concerns
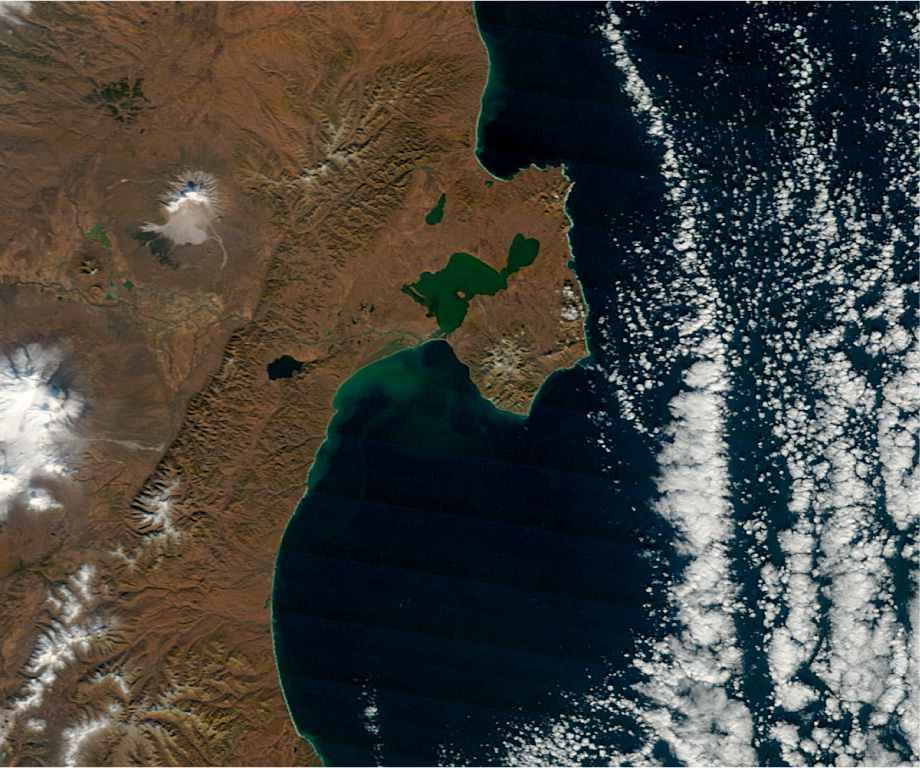
A second source for accessing and viewing EOS imagery and data is the NASA Earth Observatory Website (http://earthobservatory.nasa.gov), a sort of online “magazine” devoted to global environmental issues and to how EOS contributes to our understanding of those issues. The Earth Observatory has articles dating back to 1998, dealing with topics such as global warming, tropical deforestation, and Earth’s energy budget. The Website also features an extensive multiyear “image of the day” archive (Figure 12.12), with each feature showcasing a different environmental phenomenon or issue from around the globe as seen from space. For example, the October 13, 2012, image of the day used MODIS imagery to examine wildfires in northern Australia, while the January 27, 2009, image looked at sulfur dioxide emissions in Bulgaria as captured by OMI. Earth Observatory is an excellent source for seeing (and in some cases interacting with) remotely sensed data and imagery in action, and it can be applied to all manner of real-world situations (see Hands-on Application 12.5: Using the Earth Observatory to Work Interactively with EOS Imagery for more about the interactive components of the Website).
401
 HANDS-ON APPLICATION 12.5
Using the Earth Observatory to Work Interactively with EOS Imagery
The Earth Observatory features the ICE (Image Composite Explorer) tool, which allows users to analyze applications of remotely sensed data (we used this tool back in Hands-on Application 10.2: Examining NDVI with NASA ICE). To get started using EOS data in one of the ICE scenarios, open your Web browser and go to http://earthobservatory.nasa.gov/Experiments/ICE/Channel_Islands. This will allow you to examine MODIS products as they relate to conditions in California’s Channel Islands. The Website supplies background material on the Channel Islands and shows how MODIS is used for monitoring phytoplankton conditions. Within the page is a link to launch ICE, which will allow you to observe imagery related to sea surface temperature, chlorophyll content, and fluorescence.
Expansion Questions:

Question
How does MODIS measure chlorophyll content and fluorescence, and how can EOS imagery and data be used to monitor phytoplankton content in the oceans?
-
Question
Examine the MODIS imagery for chlorophyll, fluorescence, and sea surface temperature. What connections can be drawn between these three subjects?
NASA NEO the NASA Earth Observations Website, which allows users to view or download processed EOS imagery in a variety of formats, including a version compatible for viewing in Google Earth
Visible Earth and Earth Observatory are extensive resources for application of imagery, but to access the results of some data products themselves, NASA has set up another Website: NASA Earth Observations (NEO), at http://neo.sci.gsfc.nasa.gov. NASA NEO enables users to download processed data from EOS satellites and to examine applications centered on five main topics: oceans, atmosphere, energy, land, and life. NEO allows you to download imagery from multiple dates, to view it interactively online, and to download the data in a format compatible with Google Earth. When you view the data in Google Earth format, the EOS imagery “wraps” around the virtual globe in Google Earth, allowing you to interact with the imagery the same as you would with any other Google Earth usage. This interactive format treats the EOS imagery as an overlay on top of Google Earth, allowing you to see how EOS imagery fits with other data layers. In Geospatial Lab Application 12.1, you will be making use of NASA NEO and some of its datasets in Google Earth.
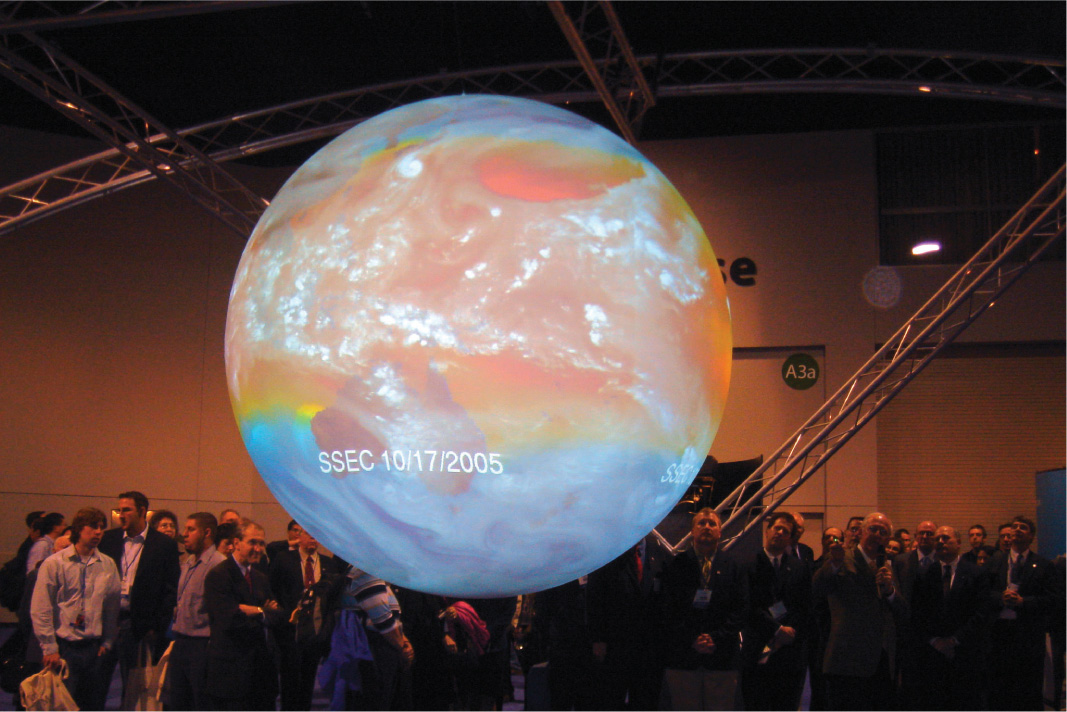
SOS Science on a Sphere, a NOAA initiative used in projecting images of Earth onto a large sphere
Another example of enhanced geospatial visualization is the National Oceanic and Atmospheric Administration’s (NOAA) Science on a Sphere (SOS) device. SOS features a large six-foot sphere that has animated images projected onto its surface, turning the sphere into a global model of Earth. With NOAA’s SOS tool, viewers can view a simulated version of Earth’s surface that allows them to see geospatial data such as ocean currents, sea surface temperature, land-use information, and global fires, as well as data products derived from satellites in the Earth Observing System (see Figure 12.13). Think of global EOS datasets that are projected onto an actual spherical surface several feet tall. Museums and science centers around the world are using SOS technology for geospatial education related to Earth and its climate and environment.
402
There are a lot of other ongoing EOS missions beyond Terra, Aqua, and Aura. For instance, the Jason-1 mission studies properties of the oceans, while the SORCE mission studies energy from the Sun. See Hands-on Application 12.6: NASA Eyes on the Earth for a very cool NASA Website filled with interactive information and data about all of the EOS satellites. Also, keep in mind that NASA doesn’t have a monopoly on broad-scale environmental remote sensing satellites. For example, NOAA operates and maintains a series of satellites dedicated to numerous environmental monitoring functions, including weather observations. See Hands-on Application 12.7: Examining Other Environmental Remote Sensing Applications for some examples of NOAA satellite imagery as well.
403
HANDS-ON APPLICATION 12.6
NASA Eyes on the Earth
NASA has set up a Web application that allows you to view the real-time positions of Terra, Aqua, Aura, and the other EOS satellite missions, and to examine 3D data maps of the products and imagery they capture. Open your Web browser and go to http://climate.nasa.gov/Eyes/eyes.html (you may have to download and install a special plugin for all of the functions to work correctly). When Eyes on the Earth opens, a separate window will open that allows you to view the orbital paths of all the EOS satellite missions (which includes Terra, Aqua, and Aura, along with other missions such as Acrimsat, Calipso, and Cloudsat). Pressing the “Real Time” button will show you the current positions and paths of the satellites. Clicking on a particular satellite in orbit allows you to access information about that mission, to view its ground path, and to compare the size of the satellite with other objects.
By selecting one of the icons at the top of the screen, you can view EOS imagery and investigate environmental applications based on topics such as global temperature, sea level, and ozone concentrations. After selecting a category, you can choose a range of dates of imagery to view as animation or as a series of images, or you can just view the most recently available data map.
Expansion Questions:
-
Question
View the latest data map of sea level variations (available via the Sea Level icon). What areas of the globe are seeing the greatest rise in sea level (based on the OSTM imagery that loads)?
-
Question
View the latest data map of carbon monoxide levels (available via the Carbon Monoxide icon). What areas of the globe are experiencing the highest levels of carbon monoxide (based on the AIRS imagery that loads)?
-
Question
View the latest data map of daytime air temperatures (available via the Global Temperature icon). What areas of the globe are seeing the warmest temperatures during the day (based on the AIRS imagery that loads)?
HANDS-ON APPLICATION 12.7
Examining Other Environmental Remote Sensing Applications
NOAA operates two types of remote sensing satellites. The GOES (Geostationary Operational Environmental Satellite) program is a series of geostationary satellites tasked with monitoring weather conditions—each satellite constantly monitors the weather at the same location. The POES (Polar Orbiting Environmental Satellites) are polar orbiting and part of a long-running series of satellites. The NOAA satellites carry the AVHRR (Advanced Very High Resolution Radiometer) sensor, which views in six bands (early versions viewed only in five). NOAA’s remote sensing program is a critical part of global data collection as it relates to climate. An example of the use of NOAA imagery for environmental monitoring is available online at http://coastwatch.glerl.noaa.gov, which takes you to the NOAA CoastWatch Great Lakes Node. At this Website, you can view very recent (and near-real-time) AVHRR and GOES imagery.
Expansion Questions:
-
Question
For the most recent day and time available under the AVHRR imagery section, what sections of Lake Michigan and Lake Huron are seeing their warmest daytime sea surface temperatures?
-
Question
What sections of the same lakes are seeing the warmest nighttime sea surface temperatures?
404