13.4 
How Are Terrain Models Created?
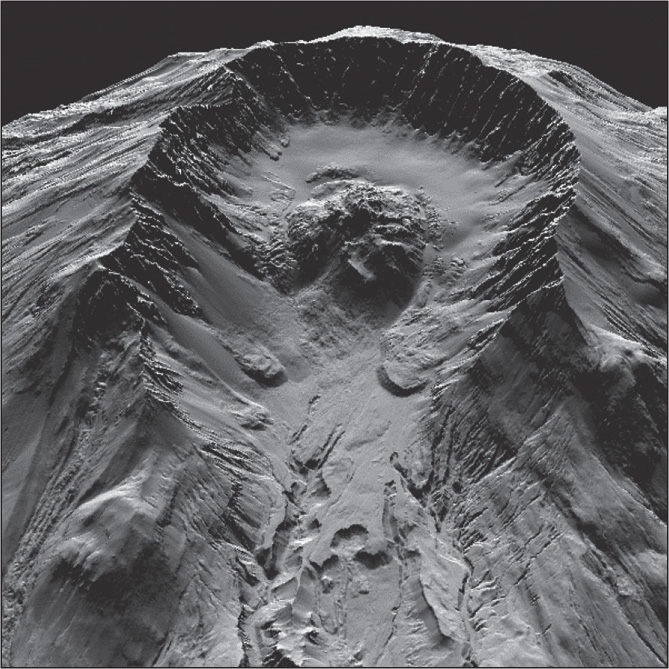
SRTM the Shuttle Radar Topography Mission, flown in February 2000, which mapped Earth’s surface from orbit for the purpose of constructing digital elevation models of the planet
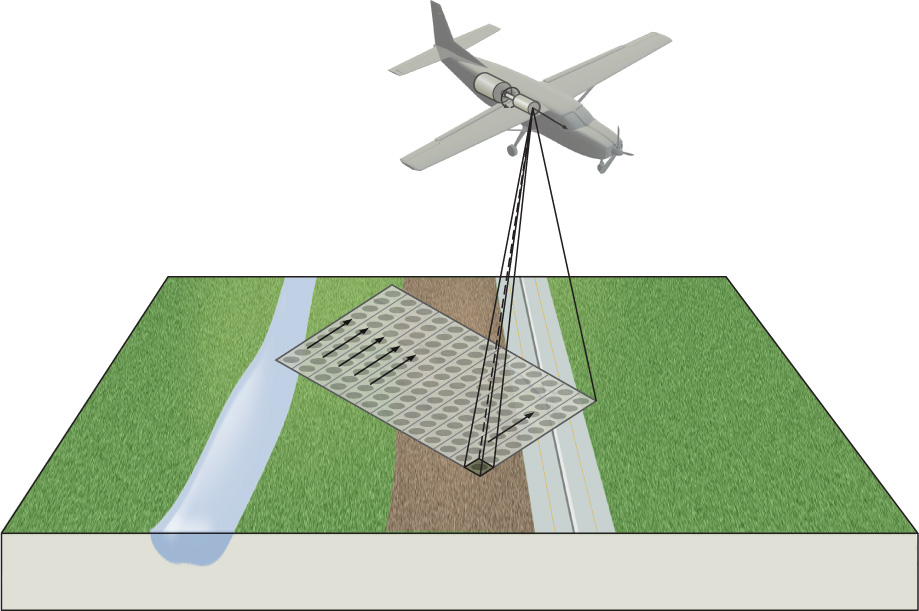
LIDAR Light Detection and Ranging. A process in which a series of laser beams fired at the ground from an aircraft is used both to create highly accurate DEMs and also to measure the height of objects from the ground
USGS DEMs have been created using Digital Line Graph (DLG) contour information. Other methods of DEM creation involve both remotely sensed data and stereo imagery (see Chapter 14) and also the use of photogrammetry to derive elevation values. Another source of terrain data is the Shuttle Radar Topography Mission (SRTM), which originated as a part of a mission of the Space Shuttle Endeavor in February 2000. For 11 days, Endeavor used a special radar system to map Earth’s terrain and topographic features from orbit, and the result was a highly accurate digital elevation model. At the mission’s close, roughly 80% of Earth was examined and modeled as 90-meter DEMs (30-meter DEM data is also available for the United States). See Hands-on Application 13.3: SRTM Imagery Online for more about SRTM data.
An additional remote sensing method of terrain mapping is called LIDAR (Light Detection and Ranging). Rather than firing a microwave pulse at a ground target as a RADAR system would, LIDAR uses a laser beam to measure the terrain. In LIDAR, a plane flies over the ground equipped with a system that fires a series of laser beams (between 2000 and 5000 pulses per second) at the ground. The laser beams are reflected from the ground back to the plane, and based on the distance from the plane to targets on the ground, the elevation of the landscape (as well as objects on the surface of the terrain) can be determined (see Figure 13.8). GPS (see Chapter 4) is used in part to determine where the beams are striking the ground.
426
 HANDS-ON APPLICATION 13.3
SRTM Imagery Online
NASA maintains an online gallery of SRTM imagery from the 2000 mission, as well as other products related to SRTM. Open your Web browser and go to http://www2.jpl.nasa.gov/srtm. Select the option for Gallery of Images to view image results of SRTM data products from around the globe. Examine examples of SRTM imagery that are set up in perspective view—check out the image galleries of North America/United States/Alaska, Utah, and Washington State; Central America/Costa Rica; and Africa/Congo. Note that these image galleries are only example graphics of SRTM results—this site does not provide a way to download the actual SRTM data.
There’s also a Multimedia option on the main page, which will allow you to view a series of video files (in RealPlayer or QuickTime) of SRTM in action. These files should help give you a feel for how terrain can be mapped from space.
Expansion Questions:

Question
Read the information and examine the SRTM images for the Congo. How were the SRTM models of the Congo’s terrain features used in conjunction with other remote sensing imagery for measuring the landscape before and after the eruption of the Nyiragongo volcano?
-
Question
Read the information and examine the SRTM images for Costa Rica. What was the major advantage of using SRTM for terrain mapping of this area? Why was SRTM able to do this?
427
LAS The industry standard data format used for LIDAR data
The data collected by LIDAR data is often referred to as point cloud data, owing to the high volume of point locations measured (you could potentially measure millions of locations in a single flight). After the data is collected and processed, the end result of a LIDAR mission is a highly accurate set of x/y locations with a z-value. The elevations of the DEM products derived from LIDAR have a vertical accuracy of 15 centimeters for open terrain (see Figure 13.9 for an example of a LIDAR-derived DEM). As LIDAR can be used to measure terrain elevations (often called “bare earth”) or the heights of objects on the ground (such as a tree canopy or the top of a building), it’s become a very versatile remote sensing tool that is used extensively in both government and private sector fields. An LAS file is the industry standard for storing LIDAR data, and many software packages (such as ArcGIS) are able to generate elevation models and calculate object heights using this data.