14.2 
How Are 3D Maps Made?
prisms the extruded shapes on a prism map
prism map a 3D thematic map from whose surface shapes (like the polygons that define states or nations) are extruded to different heights that reflect different values for the same type of data
A 3D-style map can be made by applying the kind of 3D modeling concepts that we’ve just discussed. However, this time you won’t be working with extruding polygons that represent building footprints on the ground, but with the shapes and objects on a map, and what they can represent. A regular choropleth or thematic map (see Chapter 7) can be transformed into a 3D-style map by extruding the polygons that are displayed on the map. The extruded polygons are called raised prisms, and a map that features these extrusions is referred to as a prism map. In a prism map, the shapes on the map are extruded to a height that reflects the data value assigned to them. For instance, if a thematic map of the United States is intended to show population by state, then each state’s shape will be extruded to a “height” of the number of units equal to that state’s population. Thus, the polygon shape of California will be a raised prism extruded to a value of 36.7 million, while neighboring Nevada’s shape will only be extruded to a value of 2.6 million.
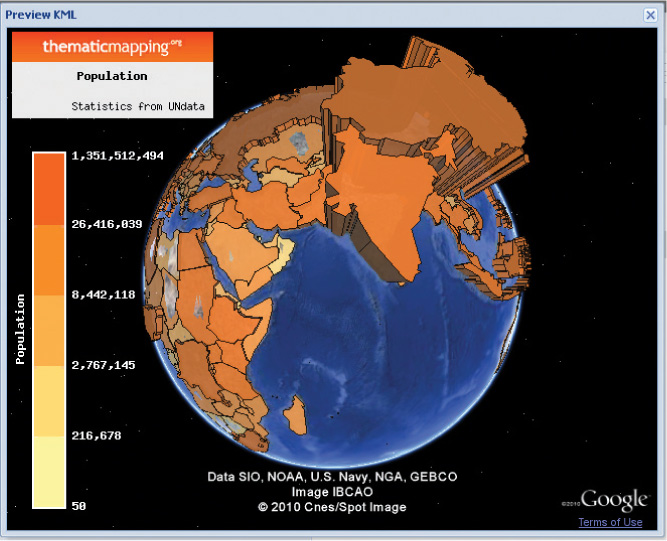
Figure 14.6 shows an example of a prism map dealing with world population. Each country polygon has a value of the population statistics for that country. Those countries with the highest raised prisms have the largest number of persons (in this example, the map shows China and India with huge populations relative to neighboring countries). The polygon shape of each country is extruded relative to the number of units being measured. See Hands-on Application 14.1: Creating Prism Maps Online for an online tool to create prism maps with.
451
 HANDS-ON APPLICATION 14.1
Creating Prism Maps Online
The Thematic Mapping Engine (also used back in Chapter 7) enables you to create prism maps and to display them using Google Earth. Open your Web browser and go to http://thematicmapping.org/engine. Select an indicator that you want to map (such as population, life expectancy, or mobile phone subscribers), and a year, and then select Prism for the technique. Press Preview to see the results in your browser or Download to open the prism map in Google Earth. Try several of the classification combinations to see how they alter the raised prisms in the data.
Expansion Questions:

Question
Create a prism map of population of the year 2010—these will be regular count values, not normalized ones (like on a choropleth map). How does a prism map help in displaying and interpreting these kinds of count data?
-
Question
Using the indicator CO2 emissions per capita for the year 2004 (using the Quantiles method of classification, with five classes), create both a prism map and a regular 2D choropleth map and download both of them into Google Earth. Switch back and forth between the two layers—what differences in visual communication does a prism map offer when mapping this dataset?