15.2 
How Is the Cloud Used with Geospatial Technology?
Posting parcel databases and DEMs for download on a server will be of great aid to anyone with some geospatial knowledge, but other people who don’t know what GIS is, what a shapefile is, or how to georeference imagery, may be baffled about how to use the data. For instance, say you’ve used GIS to map the floodplain for your local area, and you’ve used that information to determine what land parcels are on the floodplain as well as the zoning type and property value of each parcel. If you posted the floodplain layer, the parcels layer, and any tabular data that would need to be joined to the parcels on a server for others to download, people with GIS knowledge may find this collection of data very useful. However, casual Internet users might be able to download these files, but probably would not know how to view them, overlay them, or query them to find out if their properties are on the floodplain or not.
It would be more helpful if you could construct an interactive map of this data and post it online. This type of map would allow casual users to see where their property boundaries are in relation to the floodplain and find out whether or not their house is likely to be flooded. They could also click on their parcel to see the property value and zoning information. Perhaps an aerial photo of their housing development might also be available, showing the locations of nearby rivers and other water bodies. In addition, the users of the map would have easy access to it through their Web browsers. Even though you may have created the map using ArcGIS, the users wouldn’t need an expensive piece of software—they would need only a computer with a Web browser, or a smartphone or tablet with access to the Web. Suddenly your online map has the potential to become a utility for realtors to use on-site, as well as a mine of useful information for prospective home buyers.
Web map An interactive online representation of geospatial data, which can be accessed via a web browser
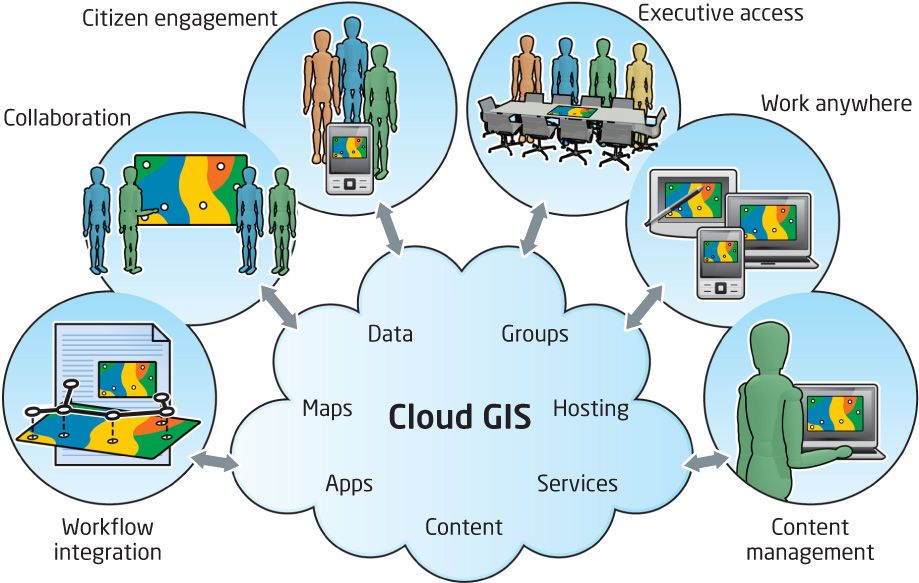
The cloud makes an ideal platform for delivering these types of online maps to end users (and you’ve already used some examples of these cloud-based online geospatial tools in the Hands-on Applications of previous chapters). All of this geospatial information can be assembled into a Web map and placed onto a server in the cloud so that anyone can use and interact with its resources by simply using the Web (Figure 15.2).
487
SaaS Software as a Service—a method by which the software and data for an application are hosted in the cloud
ArcGIS Online Esri’s cloud-based GIS platform where data and web mapping software can be accessed via the Internet
service A format for GIS data and maps to be distributed (or “served”) to others via the Internet
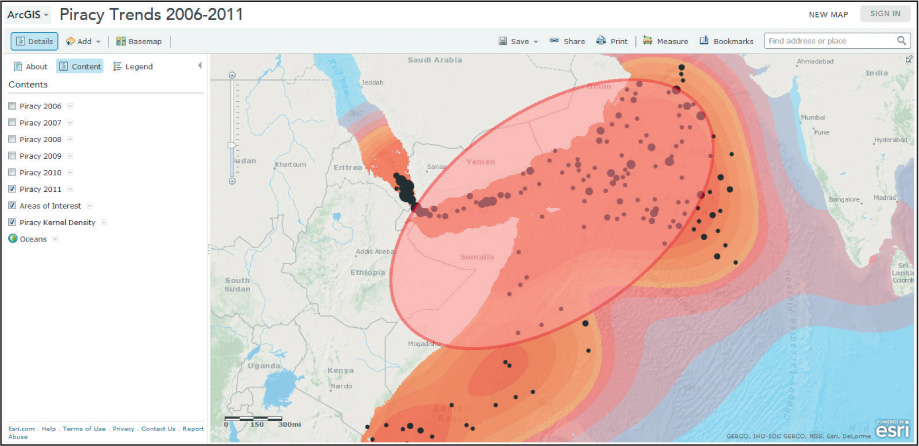
When you’re setting up (or “publishing”) a Web map, you’ll be using some type of software that will be hosted online in the cloud. There are several of these types of hosting services. One of the most popular is Software as a Service (SaaS), in which the software you’re using to run your application or map will be hosted in the cloud. Esri’s ArcGIS Online is a good example of how geospatial technology can utilize the cloud’s resources to create and publish Web maps. ArcGIS Online allows users to share datasets with the cloud, but it also gives users the tools to create Web maps and applications that can be served to others via the cloud. For example, the U.S. government resources at http://www.geoplatform.gov utilize ArcGIS Online to serve a variety of maps and datasets to users. The Desktop version of ArcGIS (beginning with version 10.1) interfaces with ArcGIS Online, allowing users to upload GIS data and maps as services to the Internet. These services can then be used to create Web maps or applications in ArcGIS Online (Figure 15.3).
Tools like these are part of a larger initiative that Esri refers to as “Mapping for Everyone,” which allows users to add to existing databases, to use special software to distribute geospatial data, and to use their own data (or data processed for them) to create and publish their own maps on their own Website. Like the user-generated content of VGI (see Chapter 1), these options put more mapping choices and geospatial data into your hands as an end user, allowing you to build, design, and customize your own mapping applications and then embed them onto a Website or e-mail a link to other people (see Hands-on Application 15.3: Mapping For Everyone for some examples of this).
 HANDS-ON APPLICATION 15.3
Mapping For Everyone
If you want to build your own Web map using available resources, you’ll need to see what sort of data is available before you start. Open your Web browser and go to http://www.esri.com/mapping-for-everyone/index.html, and select one of the options for making a map. By selecting an option, you can get information about what the data on that map represents. For the map options (such as nuclear proximity or demographics), make a sample map of your own local area.
Expansion Questions:

Question
What map layers are available for you to utilize in your own maps?
-
Question
What types of Web applications could you design using this available data?
488
basemap An image layer that serves as a backdrop for the other layers that are available in ArcGIS Online
One service that’s available from the cloud for use with Web maps or applications is a basemap—a pre-made layer over which you can lay other geospatial data. When you’re using a utility like Google Maps (as in Hands-on Application 8.4: Online Mapping and Routing Applications and Shortest Paths), you can select a view of the shortest path between locations, to be displayed over a street map or a satellite image of the area. The street map and the satellite image are examples of basemaps that other layers can be displayed on, and they can be streamed to you via the cloud and displayed in your Web browser. Geospatial data can be obtained through the cloud structure in the form of aerial or satellite imagery, digital topographic maps, and digital street maps, all of which can be used as basemaps with your own applications. Because this data is being served to you over the Internet, you don’t have to download it and set it up on your own computer.
489
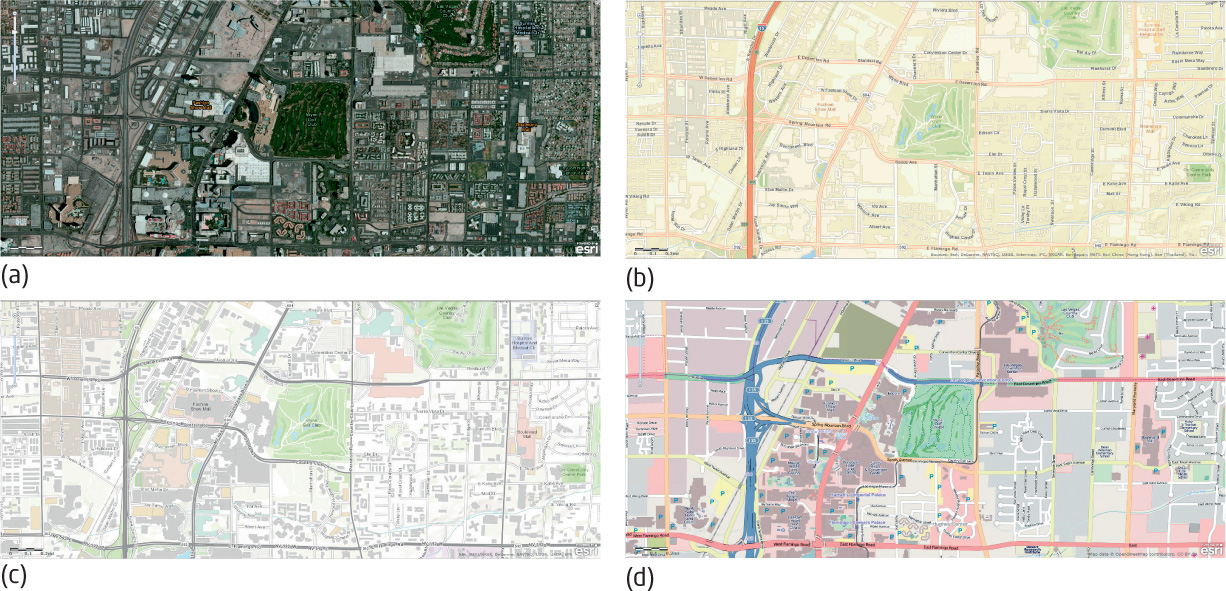
Esri makes a number of such basemaps available through its ArcGIS Online resources. If you’re using ArcGIS Online to create a map, or obtaining data through ArcGIS or ArcGIS Explorer, you can stream these basemap layers onto your computer through the Internet and use them in your GIS analyses (see Figure 15.4 for examples of the basemap data available through ArcGIS Online). For practice working with a basemap as part of creating a Web map, see Hands-on Application 15.4: Creating Web Maps with ArcGIS Online.
HANDS-ON APPLICATION 15.4
Creating Web Maps with ArcGIS Online
To get started on building a Web map of your own, point your Web browser to http://www.arcgis.com/home/webmap/viewer.html, which is a free Web mapping component of ArcGIS Online. As the Website indicates, a basic Web map can be made in just a few simple steps. First, pan and zoom the map to your own local area. Next, press the Basemap button to select an appropriate basemap to use as a starting point for your Web map (for now, choose Imagery with Labels). The next step is to add some data to the map—you could add your own shapefiles or GPS data, but for the purposes of this map we’ll use data that’s already on ArcGIS Online. Press the Add button and select Search for Layers—this will allow you to search through the data in the ArcGIS Online cloud to find items to add to your map. Search for household income, choose the layer called USA Median Household Income, and then add this to the map. Once the layer is added, press the Details button to return to designing the map. From the three Details options, select the Show Contents of Map button—this will show you the layers in your map. Place the mouse next to the USA Median Household Income layer and an arrow will appear, allowing you to access menu items to alter this layer. Choose the Transparency option and set the layer’s opaque level to about 30%. You should be able to see some of the imagery and the labels under the block groups’ information. Next (under the Details options), select the Show Map Legend button, and the values for each of the mapped categories will appear. You can now click on one of the areas on the map and a pop-up with household income for that block group (or other areal unit, depending on the scale of the map) will appear. Lastly, if you want to save your work (to share it with others via ArcGIS Online), you will need a free Esri Global Account to access ArcGIS Online. To save your work, click the Save button (and log on to ArcGIS Online if you’re prompted to do so). When your map’s been saved, you can access it at any time by logging in to ArcGIS Online and clicking on My Content, and if you want other people to see and use your Web map, you can click on Share. You can also embed your Web map on a Website, or create a Web application from it.
Expansion Questions:
-
Question
What other types of maps could you make of your local area, using just these basic tools and data available through ArcGIS Online?
-
Question
Once your Web map is saved, share it to create a Web application. What options are available for a Web application and how is a Web app different from a Web map?
ArcGIS Server an Esri utility for distribution of geospatial data in an interactive mapping format on the Internet
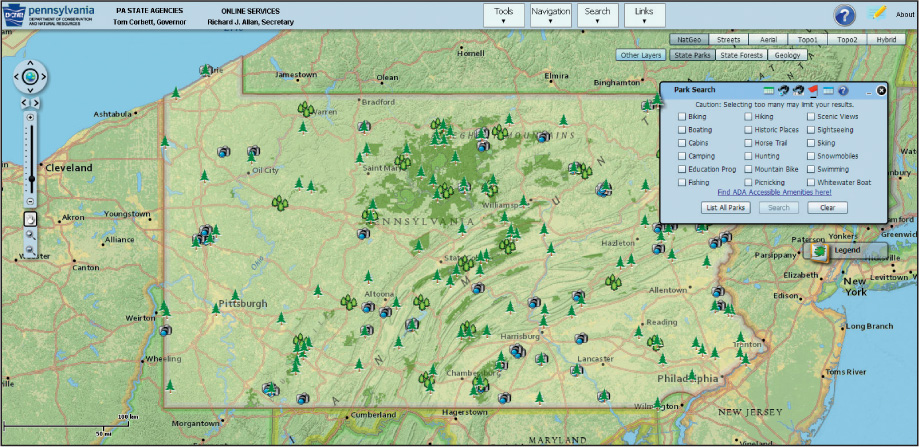
There are many programs available for taking geospatial data and setting it up online in an easy-to-use interactive format, and for creating an interactive map to incorporate into a Website. ArcGIS Server is a good example—this Esri software is designed to facilitate the distribution of interactive maps and geospatial data across the Internet, for viewing and analysis. (See Figure 15.5, which shows an online mapping and analysis application created for the Pennsylvania Department of Conservation and Natural Resources using ArcGIS Server.) Setting up interactive online tools for managing and analyzing geospatial data is becoming increasingly common for a variety of utilities. Check out Hands-on Application 15.5: ArcGIS for Server Showcase for a way to access and examine several examples of ArcGIS Server in action, allowing you to work with applications of geospatial data online (rather than running ArcGIS on your own computer).
HANDS-ON APPLICATION 15.5
ArcGIS for Server Showcase
In previous chapters, we’ve explored several Web applications. We’ve perfomed queries, built buffers, checked color choices, found shortest paths, and georeferenced maps. There are more—a lot more—Web application sites out there. Check out some of the ArcGIS for Server Showcase sites—open your Web browser, go to http://www.esri.com/software/arcgis/arcgisserver/showcase, and take a look at some of the available apps. Click on a map, and a brief description will appear—along with a link to “View App” (that is, use a particular application). All of these apps use ArcGIS Server to construct Web maps and Web applications.
Expansion Questions:
-
Question
What are some of the capabilities of ArcGIS Server Web applications?
-
Question
How are geospatial concepts being implemented as apps?
490
API Application Programming Interface—the functions and commands used when making requests of software
mashup the combination of two or more map layers into one new application
Web applications are created with the help of an API (Application Programming Interface) that can be used for Web development. For example, Esri supports Javascript, Adobe Flex, and Microsoft Silverlight APIs for developing Web applications for ArcGIS. Other companies, like Google, Microsoft, and Yahoo!, provide APIs that allow you to embed their mapping products (Google Earth, Google Maps, Bing Maps, or Yahoo! Maps, etc.) as functions on Websites. By combining several map layers together, a user can create a new map mashup, which uses different datasets together in one map. Check out Hands-on Application 15.6: More Than a Map for some examples of the Google Maps API in action as an agent for developing a wide variety of geospatial Web applications.
HANDS-ON APPLICATION 15.6
More Than a Map—The Google Maps API
To examine some of the applications of the Google Maps API, point your Web browser to http://www.morethanamap.com. Click on Demos to see various examples of the Google Maps API in action, utilizing basemaps, satellite imagery, street views, routing, and data visualization. Within each one of these options, you can view different presentations of data—for instance, on the Satellite link you can examine high-resolution overhead views, as well as 45-degree oblique imagery. Under the Developer Stories link, you can read about and see videos of different Google Maps API applications.
Expansion Questions:
-
Question
What sort of real-world applications have been developed using the Google Maps API, and what have they been used for?
-
Question
How are the applications for satellite imagery, street views, and data visualization being used to visualize and communicate geospatial information?
491
Users can create Web maps or applications that can be distributed to everyone via the cloud, thereby circulating geospatial knowledge and making geospatial tools freely available. Users of an interactive Web map of a local metropark may have never before seen the letters G, I, and S together in an acronym, but they can still access the Web map on their smartphone or tablet to locate service stations, places to eat, points of interest, and their location on a hiking trail. GIS analysts can carry out extensive studies of crime hotspots, and law enforcement officers can make use of this data via an updated Web application served to them from the cloud. In the aftermath of a disaster, rescue and relief teams can examine frequently updated maps showing blocked roads, locations of emergency calls, and remotely sensed imagery of the area, all available through Web maps or via applications shared in the cloud. All these new developments in the geospatial world open an increasingly wide variety of professional and educational opportunities to people who are interested or trained in geospatial technology.
492
 THINKING CRITICALLY WITH
GEOSPATIAL TECHNOLOGY 15.1
Who Owns Geospatial Data?
Here’s something for you to think about. You start with a basemap sample (say, a world topographic map), and you obtain data about earthquake locations and other natural hazards. You create a Web map using ArcGIS Online, and post it onto your Website. Who owns this geospatial resource, and who owns the geospatial dataset you’ve created? In essence, you’ve taken other freely available data and created your own unique geospatial resource—but can you really lay claim to it as something you own? Similarly, if you make changes or updates to a resource like Wikimapia or OpenStreetMap, can you claim ownership of a shared online resource? With more and more geospatial data and customization functions becoming available via cloud resources (such as the high-resolution imagery that’s available through ArcGIS Online), who really owns the end products created from them (or does anybody really own them)?