2.3 
How Can Real-World Data Be Translated onto a Two-Dimensional Surface?
map projection the translation of locations on the three-dimensional (3D) Earth to a two-dimensional (2D) surface
These measurements belong to a three-dimensional world, but are all translated, for ease of use, into two dimensions (flat surfaces like pieces of paper and computer screens). A map projection is a translation of coordinates and locations from their places in the real world to a flat surface, and this type of translation is necessary if we want to be able to use this geospatial data. The biggest problem with a map projection is that not everything is going to translate perfectly from a three-dimensional object to a two-dimensional surface. In fact, the only representation of the world that would accurately capture every feature would be a globe. Since it’s hard to keep a globe in the glove compartment of the car, we’re going to have to make do with flat surface representations of the world (like paper maps and electronic screens), and realize that such representations will always have some sort of distortions built into them, simply because they’re two-dimensional versions of a three-dimensional reality. One or more of the following will be distorted in a map projection: the shape of objects, the size of objects, the distance between objects, or the direction of objects. Some map projections may retain the shape of continents but misrepresent their land area. Other projections may present the land area accurately but throw the shapes out of place.
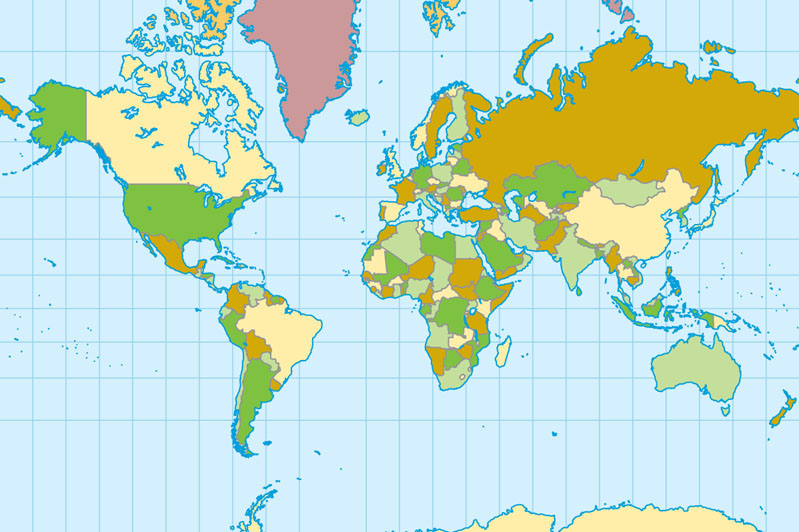
An example of this translation of the world into two dimensions is the Mercator projection (Figure 2.4), a map developed in 1569 by a Flemish cartographer known as Gerardus Mercator for use as a navigation aid—it was designed so that every straight line on the map was a line of constant direction. The Mercator projection encompasses the whole globe, and while it keeps the shapes of areas intact (that is, the continents look the way they should), the sizes (that is, the areas of land masses) are very distorted, and become more distorted the further you go from the Equator. For example, take a look at Greenland and Africa—they look to be about the same size on the map, even though Africa is really more than 13 times larger in area than Greenland. Similar problems can be seen with Antarctica and Russia, which (while they have the right shape) look overwhelming in land area compared with their actual size.
42
Think of a projection like this. Imagine a see-through globe of Earth with the various landforms painted on it, and lines of latitude and longitude clearly marked. If you could place a light bulb inside the globe and turn it on, it would cast shadows of the continents and the lines of latitude and longitude on the walls of the room. In essence, you’ve “projected” the three-dimensional world on the surfaces of the walls. However, to make a map projection, you’d have to wrap a piece of paper around the globe and preserve or copy (i.e. project) the lines on to that paper. Then, when you unrolled the paper, you’d have the globe translated onto the map.
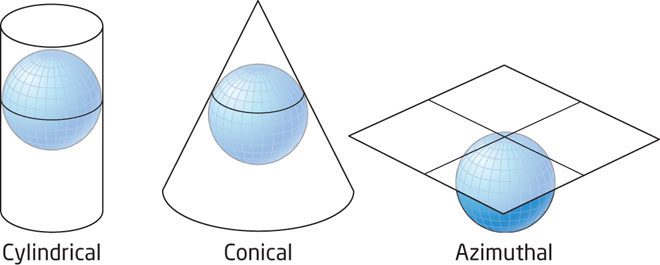
The real process of mapmaking is a much more complicated mathematical translation of coordinates, but the basic concept is similar. A map projection is created through the use of a developable surface, or a flat area on which the locations from Earth can be placed. In this way, the locations on Earth’s surface get translated onto the flat surface. The three main developable surfaces (Figure 2.5) that are used in this fashion are a cylinder (which creates a cylindrical projection), a cone (which creates a conical projection), and a flat plane (which creates an azimuthal surface). The place where Earth “touches” the surface is called the point of tangency, which is where the map’s distortion is at its least.
Like datums, there are numerous map projections available, each with its own specific uses and its own built-in distortions (see Hands-on Application 2.2: Examining the Effects of Different Map Projections for more information). Two projections that you’ll often encounter with geospatial data are the Lambert Conformal Conic and the Transverse Mercator.
43
Lambert Conformal Conic
This is a conic projection, in which a cone intersects Earth at two parallels. The choice of these tangency lines is important, as the distortion on the map is reduced as you get closer to them and increases the farther you move away from them. The Lambert Conformal Conic projection is commonly used for geospatial data about the United States (and other east-west trending areas).
Transverse Mercator
This is a cylindrical projection, with the tangency being the intersection between the cylinder and Earth. Measurements are most accurate at that point, and the distortions are worst in the areas of the map farthest away from that point, to the east or west. It’s considered “transverse” because the cylinder is wrapped around the poles, rather than around the Equator. Transverse Mercator is used most for north-south trending areas.
44
 HANDS-ON APPLICATION 2.2
Examining the Effects of Different Map Projections
Different map projections misrepresent Earth in different ways, each one distorting certain features and representing certain other features accurately. To interactively examine the characteristics of different map projections, open your Web browser and go to http://projections.mgis.psu.edu. This Website enables you to select different projections and see how different the world looks on each of them. Switch the projection to view the world map as Mercator, Lambert Conformal Conic, and Transverse Mercator, and then select the option to redraw the map.
Expansion Questions:

Question
How does each of these map projections alter the map as drawn? What kinds of distortions (shape, area, distance, or direction) appear to be built into each projection?
-
Question
Try some of the other map projection options. What types of distortions and changes enter the map with each projection?
GCS coordinates can find locations across the entire globe, down to precise measurements of degrees, minutes, and seconds. However, latitude and longitude is not the only coordinate system used today—there are several coordinate systems that use a map projection to translate locations on Earth’s surface to a Cartesian grid system using x and y measurements. Two grid systems widely utilized with geospatial data are UTM and SPCS.