5.1 
How Does GIS Represent Real-World Items?
GIS has a multitude of applications, ranging from mapping natural gas pipelines to determining which parts of the natural landscape are under the greatest pressure to be developed. No matter the application, the data (such as the locations and lengths of pipelines or the area and extent of land cover) needs to be represented somehow within the GIS. GIS provides a means of representing (or modeling) this data in a computer environment so that it can be easily analyzed or manipulated. A model is a kind of representation that simplifies or generalizes real-world information. For instance, if you were tasked to make a map of all of the stop signs in your city, you’d need to be able to represent the locations of all the signs on a map at the scale of the entire city. By laying out a map of the city and placing a dot at each sign location, you would have a good representation of them. The same holds true if you had to come up with a map of all the roads in your town. You could attempt to draw the roads at their correct width, but the roads’ locations can be represented simply and accurately by lines drawn on the map.
112
 HANDS-ON APPLICATION 5.2
ArcGIS Online
There are a lot of GIS applications available online that are used for mapping and analysis of geospatial data. For some interactive examples, open your Web browser and go to: http://www.arcgis.com/home (this is the Website for ArcGIS Online). We’ll talk a lot more about ArcGIS (and its manufacturer, Esri) later in this chapter, but for now we’ll be examining some of the online applications that have been developed by ArcGIS. From the main page, select the option to Sign in – to do so you’ll need an Esri Global Account. If you have one, use it to sign in, but if not, just select the option to create one (it’s free and will allow you to access the features of ArcGIS Online). Once you’re signed in, select the option for Gallery. You’ll be presented with several Web maps (select the option for Maps) and Web applications (select the option for Web Apps) that have been designed and made available through ArcGIS Online. When you open a Web application, you’ll be placed into a GIS environment where you can pan around the map, zoom in and out, measure distances and areas, and get information back (as a pop-up) about layers on the map. There’s a lot more that can be done with ArcGIS Online—in Chapter 15, you’ll use its resources to create Web maps and applications of your own.
Expansion Questions:

Question
What kinds of features are being mapped in the Web maps available online (hint: you may need to display the legend of each map for further information—this is available in the left-hand panel of the Web map)?
-
Question
How are the Web maps able to convey non-spatial information to the user (hint: click on some of the features in the Web map itself)
discrete object view a conceptualization of the world in which all reality can be represented by a series of separate objects
Whenever you’re considering how to model real-world phenomena with a GIS, you first have to decide on the nature of the items you want to represent. In the GIS, there are two ways of viewing the world. The first is called the discrete object view. In the discrete object view, the world is made up of a series of objects, each of which has a fixed location, or a fixed starting and stopping point, or some sort of fixed boundary. A street starts at one point and ends at another, or there is a definite property boundary between your property and your neighbor’s. Around a university campus, there will be numerous objects—representing buildings, parking lots, stop signs, benches, roads, trees, and sidewalks. By viewing the world in this way, real-world items can be modeled in the GIS as a series of objects (like a collection of lines to represent a road system, or a series of points to represent fire hydrant locations).
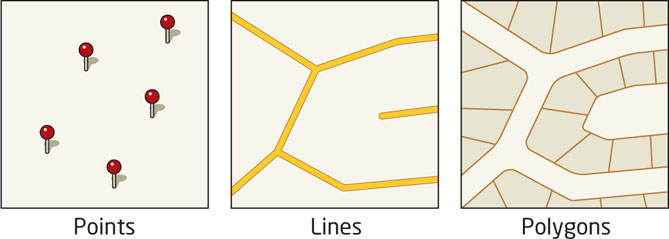
When adapting the discrete object view of the world to a data model, items in the real world are represented in the GIS by one of three objects (Figure 5.2):
113
points zero-dimensional vector objects
lines one-dimensional vector objects
polygons two-dimensional vector objects
vector objects points, lines, and polygons that are used to model real-world phenomena using the vector data model
vector data model a conceptualization of the world that represents spatial data as a series of vector objects (points, line, and polygons)
- Points: These are zero-dimensional objects, a simple set of coordinate locations.
- Lines: These are one-dimensional objects, created from connecting starting and ending points (and any points in between that give the line its shape).
- Polygons: These are two-dimensional objects that form an area from a set of lines (or having an area defined by a line forming a boundary).
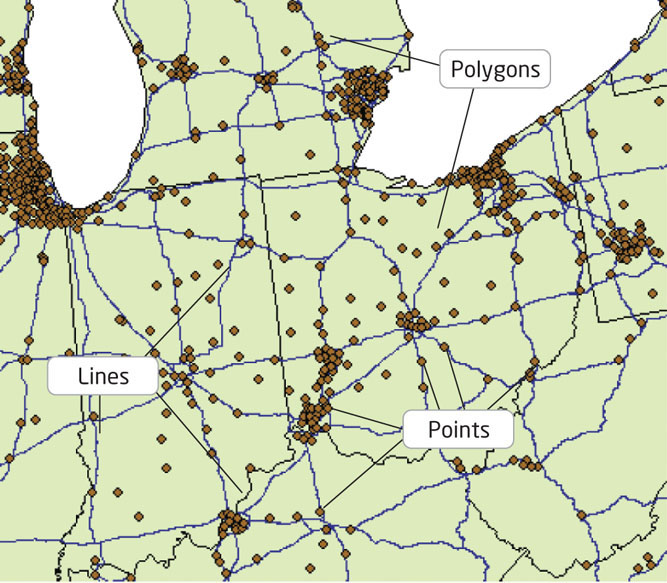
These three items are referred to as vector objects, as they make up the basis of the GIS vector data model. Basically, the vector data model is a means of representing and handling real-world spatial information as a series of vector objects—items are realized in the GIS as points, lines, or polygons. For instance, locations of fire hydrants, crime incidents, or trailheads can be represented as points; roads, streams, or power conduits are represented as lines; and land parcels, building footprints, and county boundaries are represented as polygons. When dealing with a much larger geographic area (for instance, a map of the whole United States), cities may be represented as points, interstates as lines, and state boundaries as polygons (Figure 5.3).
114
digitizing the creation of vector objects through sketching or tracing representations from a map or image source
A lot of GIS data has already been created (such as road networks, boundaries, utilities, etc.), but in order to update or develop your own data, there are a few steps that need to be taken. Digitizing is a common way to create the points, lines, and polygons of vector data. With digitizing, you are (in essence) “tracing” or “sketching” over the top of areas on a map or other image to model features in that map or image in the GIS. For instance, if you have an aerial photograph of your house being shown on the screen of your GIS software, you could use the mouse to sketch the outline of your house to create a polygon and save it in the GIS as a representation of your house. If you sketch outlines of four of your neighbors’ houses as well, you’ll have several polygons stored in a single layer in the GIS. When you examine the data, you’ll find you have five polygon entries in that data layer (your house and four others). Similarly, you could sketch each house’s driveway as a line object by tracing the mouse over the appropriate place in the image, which would result in a second data layer that’s comprised of five lines. With digitizing, each of your sketches can be translated into a vector object.
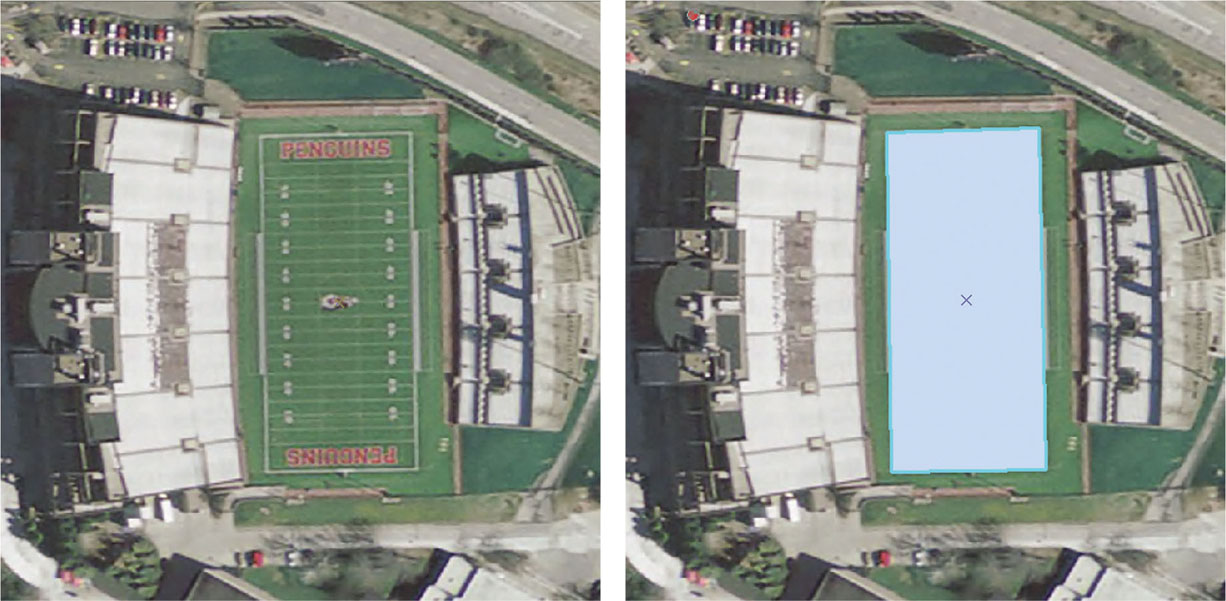
Digitizing is commonly done through a process referred to as “heads-up digitizing” or “on-screen digitizing,” which is similar to the sketching just described. In “heads-up” digitizing, a map or other image (usually an aerial photograph or satellite image) is displayed on the screen as a backdrop. Decide if you’ll be sketching points, lines, or polygons and create an empty data layer of the appropriate type (to hold the sketches you’ll make). From there, you use the mouse to sketch over the objects, using as much detail as you see fit (Figure 5.4). Keep in mind that despite your best efforts, it may likely be impossible or unfeasible to sketch every detail in the image. For instance, when you’re tracing a river, it may not be possible to capture each bend or curve by digitizing straight lines.
topology how vector objects relate to each other (in terms of their adjacency, connectivity, and containment) independently of the objects’ coordinates
When objects are created in GIS, they can be set up with coordinates, but the GIS still needs to have knowledge of how these objects connect to each other and what relation each object has to the others. For instance, when two lines are digitized that represent crossing streets, the GIS needs to have some sort of information that an intersection should be placed where the two lines cross. Similarly, if you have digitized two residential parcels, the GIS would require some information that the two parcels are adjacent to one another. This notion of the GIS being able to understand how objects connect to one another independent of their coordinates is referred to as topology. With topology, geometric characteristics aren’t changed, no matter how the dataset may be altered (by projecting or transforming the data). Topology establishes adjacency (that is, how one polygon relates to another polygon, in that they share a common boundary), connectivity (that is, how lines can intersect with one another), and containment (that is, how locations are situated inside of a polygon boundary).
115
DLG a Digital Line Graph—the features (such as roads, rivers, or boundaries) digitized from USGS maps
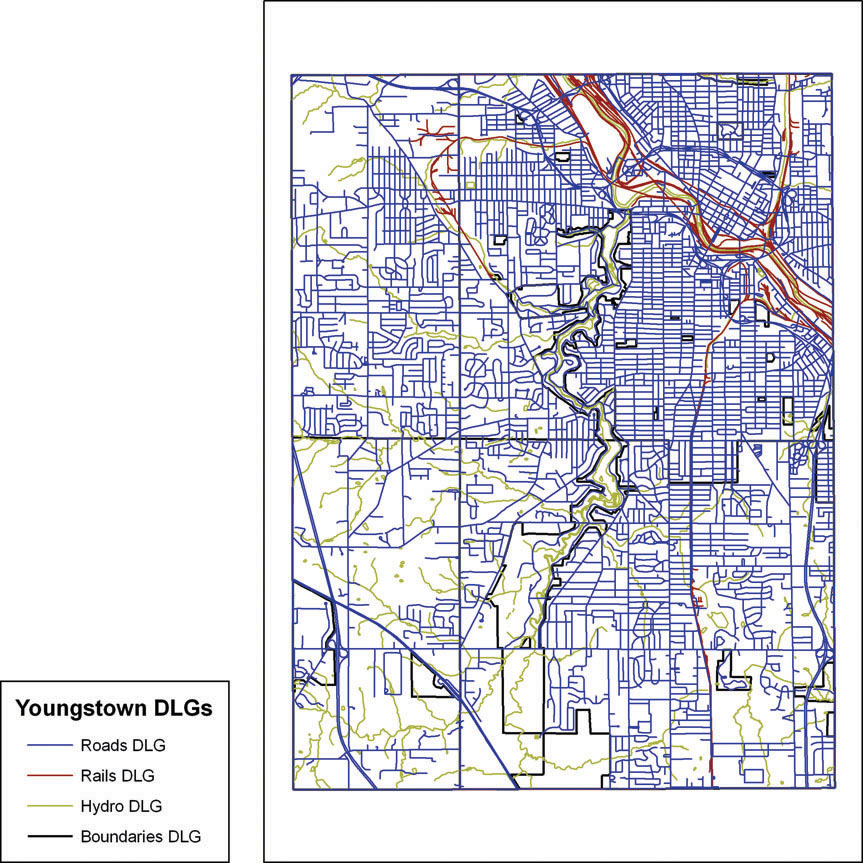
Digital Line Graphs (DLGs) are examples of vector data applications in GIS. DLGs were created from United States Geologic Survey (USGS) topographic maps (see Chapter 13 for more information about topographic maps), featuring vector datasets representing transportation features (such as streets, highways, and railroads), hydrography features (such as rivers or streams), or boundaries (such as state, county, city, or national forest borders). Since these topographic maps are no longer being produced, neither are the corresponding DLGs, but the existing products are freely distributed by the USGS (see Figure 5.5 for an example of several DLGs in GIS). The DLGs were created by digitizing, using a USGS map as the source and the map features (like roads or rivers) turned into a digital format using GIS. See Hands-on Application 5.3: USGS Digital Line Graphs for more about how to obtain DLGs.
HANDS-ON APPLICATION 5.3
USGS Digital Line Graphs
Digital Line Graphs are made freely available by the USGS. A good online utility for examining available DLGs is EarthExplorer, a Website designed to facilitate access to a wide range of geospatial data (not just DLGs). To get started, open your Web browser and go to http://earthexplorer.usgs.gov. Using EarthExplorer is a four-step process. First, select the Search Criteria tab and type the name of a location or an address or place name (such as Reno, Nevada). Next, click on Data Sets and place checkmarks in the DLG 1:100k and DLG Large Scale boxes under the Digital Line Graphs option. Next, click Additional Criteria—this is where you can further refine your search, if you want to. Last, click Results to see what EarthExplorer will turn up. From the available options in the results, you can see the footprint that the DLG would cover. If desired, DLGs can be downloaded to use in GIS (they may need to be imported into a specific format, and the USGS requires a user to register and log in with them in order to download data). Check your local area to see what types of DLGs are available.
Expansion Questions:
-
Question
What is the difference in coverage size between 1:100,000 DLGs and the Large Scale DLGs (hint: under the Data Set pull-down menu you can switch between the Results for the two options)?
-
Question
For Reno, Nevada, what types of DLGs are available (i.e., railroads, transportation features, etc.)?
-
Question
Similarly, for your own local area, what types of DLGs are available?
116
continuous field view a conceptualization of the world in which all items vary across Earth’s surface as constant fields, and values are available at all locations along the field
There’s also a second way of viewing the world, in which not everything has a fixed boundary or is an object. For instance, things such as temperature, atmospheric pressure, and elevation vary across Earth and are not best represented in GIS as a set of objects. Instead, they can be thought of as a surface that’s made up of a near-infinite set of points. This way of viewing the world is called the continuous field view. This view implies that real-world phenomena continuously vary, and rather than a set of objects, a surface filled with values is used to represent things. For instance, elevation gradually varies across a landscape from high elevations to low elevations filled with hills, valleys, and flatlands, and at every location we can measure the height of the land. Similarly, if you’re standing at a ranger station in a park and preparing a rescue plan for stranded hikers, you’ll want to know the distance from the station to every location in the park. Thus, you could have two layers in your GIS—one showing the elevation at every place and another showing the distance to the ranger station at each location.
117