6
Using GIS for Spatial Analysis
158
Database Query and Selection, Buffers, Overlay Operations, Geoprocessing Concepts, and Modeling with GIS
spatial analysis examining the characteristics or features of spatial data, or how features spatially relate to one another
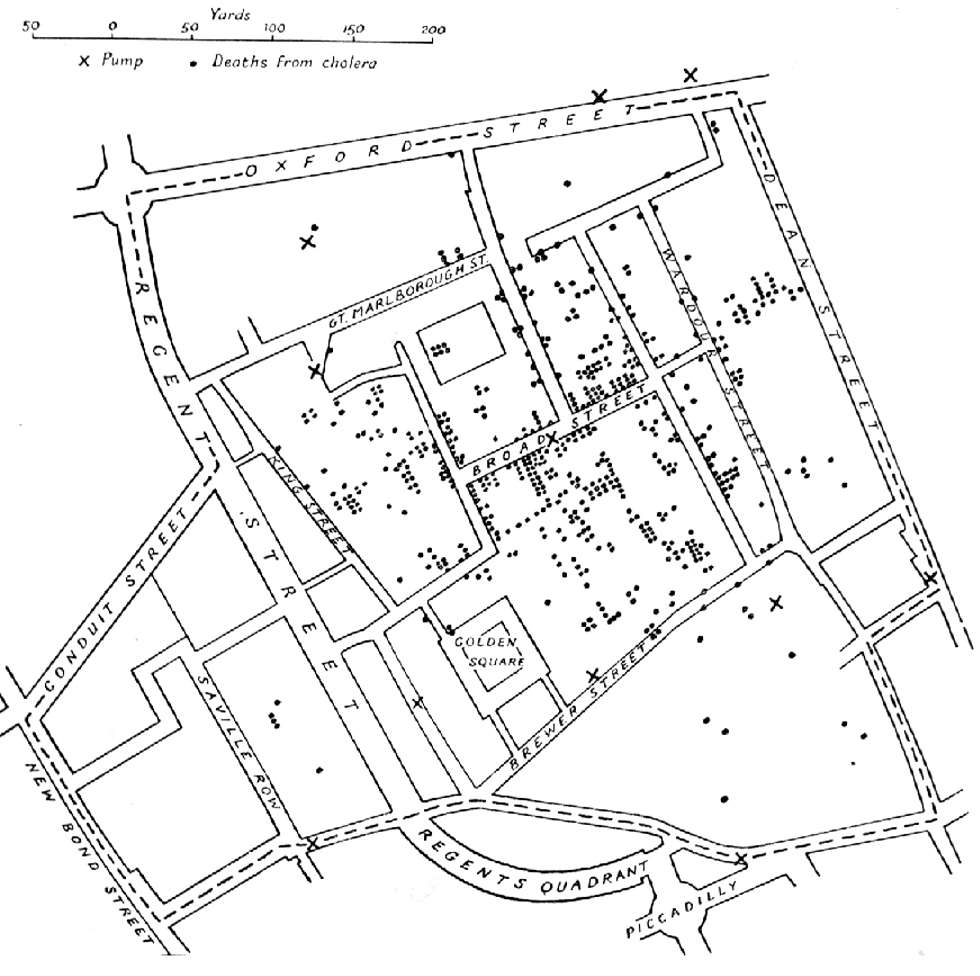
Chapter 5 described the basic components of GIS and how it operates, so now it’s time to start doing some things with that GIS data. Anytime you are examining the spatial characteristics of data, or how objects relate to one another across distances, you’re performing spatial analysis. A very early (pre-computer) example of this is Dr. John Snow’s work during an 1854 epidemic of cholera in Soho, central London—a poor, overcrowded square mile of narrow streets and alleyways. His analysis was able to identify the infected water from one pump as the source of the outbreak. At some point, Snow mapped the locations of the cholera deaths in relation to the water pumps (Figure 6.1). This type of spatial analysis (relating locations of cholera deaths to the positions of water pumps) was innovative for the mid-nineteenth century, but is commonplace today—with GIS, these types of spatial analysis problems can be easily addressed.
Other common forms of spatial analysis questions include the following:
 How many objects of a particular type are within a certain distance of a particular location? Questions like this can all be answered, and they’re asked for all kinds of reasons. Location researchers for a fast food chain might ask, “How many fast food restaurants are within one mile of this interstate exit?” A realtor might ask, “How many rental properties are within two blocks of this house that’s for sale?” An environmentalist might ask, “What acreage of wetland will be threatened with removal by this proposed development?”
- How do you choose the most suitable locations, based on a set of criteria? Many different types of questions related to this topic can be answered, such as those involving where to locate new commercial developments, new real estate options, or the best places for animal habitats.
159
This chapter examines how GIS can be used with geospatial data to answer questions like these in the context of spatial analysis. Keep in mind the two ways that GIS is used to model real-world data from the previous chapter—vector and raster. Due to the nature of some kinds of geospatial data, some types of spatial analysis are best handled with vector data and some with raster data.