6.3 
How Can Multiple Types of Spatial Analysis Operations Be Performed in GIS?
Often there are many criteria that play into the choice of site suitability or into determining what might be the “best” or “worst” locations for something, and often it’s not as cut and dried as “the location contains water” (values of 1) or “the location does not contain water” (values of 0). Think about the vacation home example—locations were classified as either “close to water” or “not close to water.” When you’re choosing a vacation home location, there could be locations right on the water, somewhat removed from it but still close enough for recreation, and some that are much further away from water. Similarly, terrain is so varied, it’s difficult to assign it a characteristic of “mountainous” or “not mountainous.” Instead, a larger range of values could be assigned—perhaps on a scale of 1 through 5, with 5 being the best terrain for hiking or the closest to the water and 1 being furthest away from the water or the least desirable terrain for hiking.
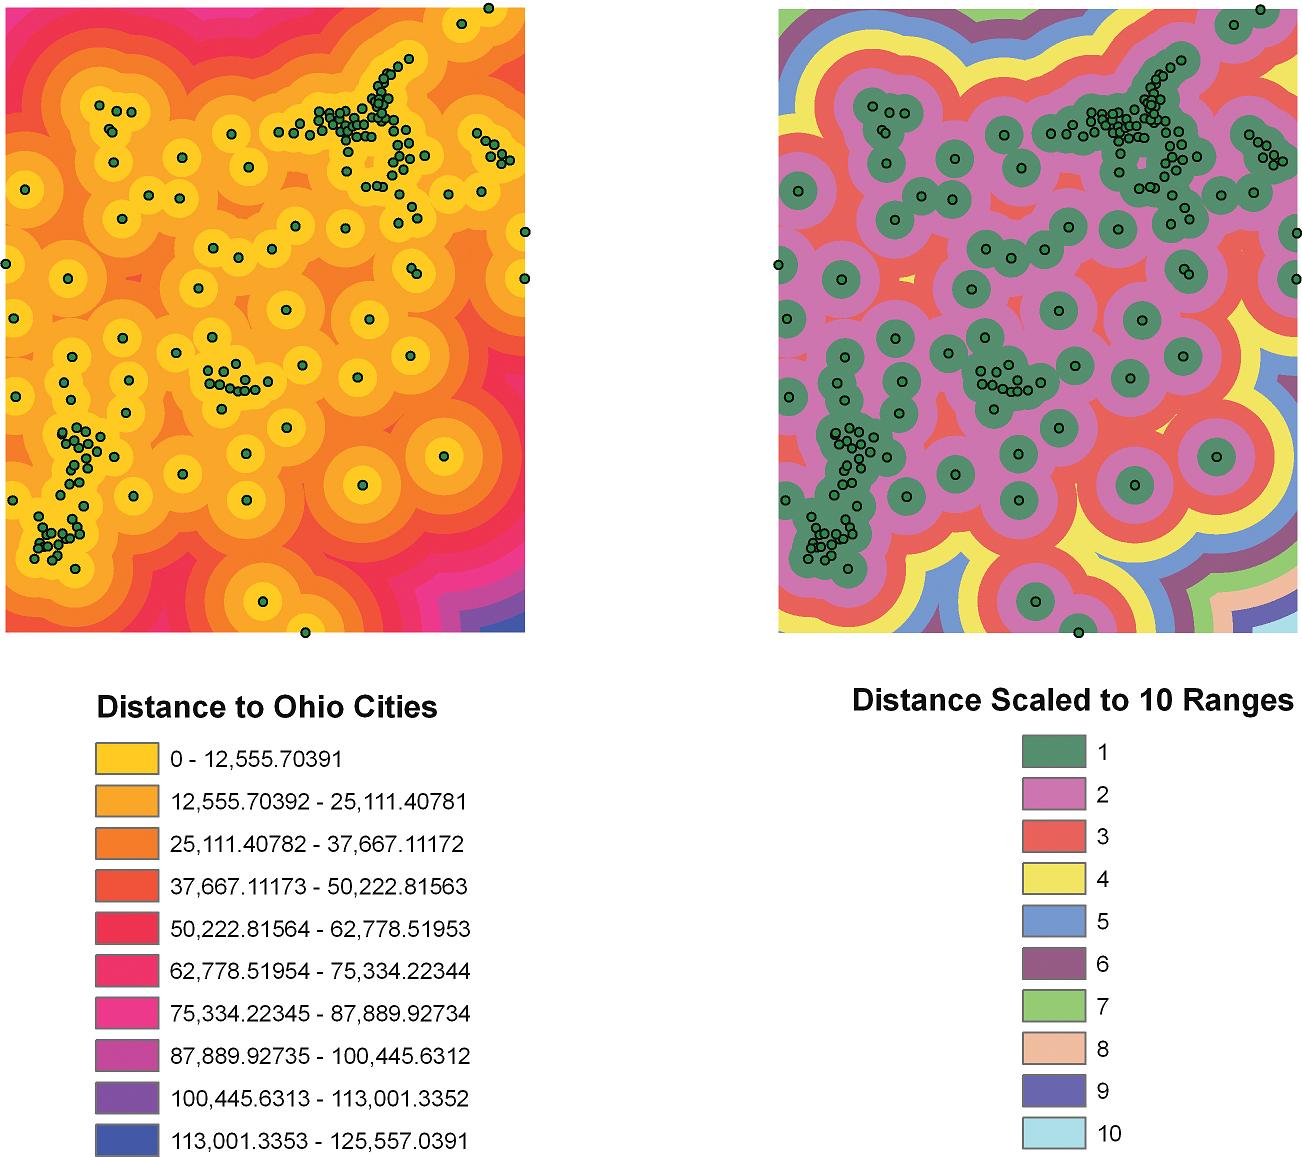
In order to set something like this up, a distance calculation can be performed. GIS can calculate the distance from one point to all other points on a map, or calculate the distance a location is from all other features. For example, when you’re examining a location for building a house in a rural locale, you may want to know the distance that spot is from a landfill or waste-water treatment plant. Alternatively, you may want to know the distance a vacation home is away from a lake or river. A way of conceptualizing distance (as is done in ArcGIS) is to think of it as a continuous surface (see Chapter 5), where each spot on that surface has a value for the distance it is away from a feature. ArcGIS makes these measurements by calculating a distance surface of raster grid cells, with each cell containing a value of the distance from the features in a layer. Figure 6.10 illustrates this by mapping the location of a set of cities in Ohio and calculating the distance that each cell is away from a city. Next, the distance from the cities is sliced into ten equal ranges (that is, all of the areas closest to a city are given a value of 1, the next closest are given a value of 2, and so forth).
suitability index a system whereby locations are "ranked" according to how well they fit a set of criteria
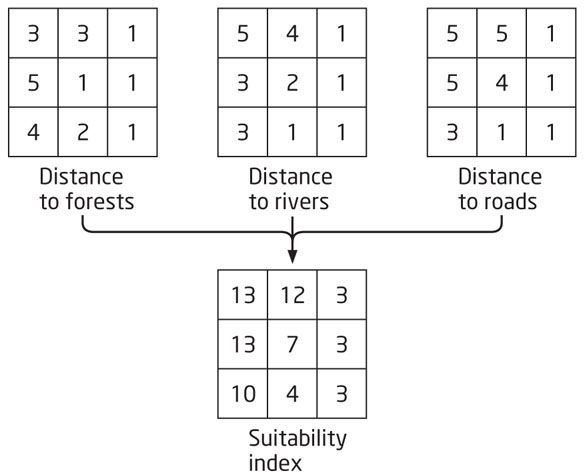
For this example, we’ll come up with a new set of grids classified along these lines and throw in a third option as well—distance away from roads (on the assumption that a vacation home would be best located well away from busy roads and the accompanying automobile noise). In all of these, the highest values represent the “best” options (the places furthest away from busy roads), and the lowest values represent the “worst” options (right next to a busy road). Figure 6.11 shows the new grids and how they are overlaid together through the addition operation to create a new output grid. Rather than choices of 0, 1, and 2, the output grid contains a wide range of options, where the highest number reflects the most suitable site based on the criteria and the lowest number reflects the least suitable sites. This new grid represents a very simple suitability index, where a range of values is generated, indicating a ranking of the viability of locations (these would be ordinal values, as we discussed back in Chapter 5). In the example in Figure 6.11, the values of 13 represent the most suitable sites, the values of 12 and 10 are possible alternative venues. The value of 7 is likely a mediocre site, and the values of 4 and 3 are probably unacceptable. The advantage of the suitability index is to offer a wider gradient of choices for suitable sites as an alternative to some of the previous options. Note that while this example is using raster data, you can also perform site suitability analysis actions using vector data.
171
172
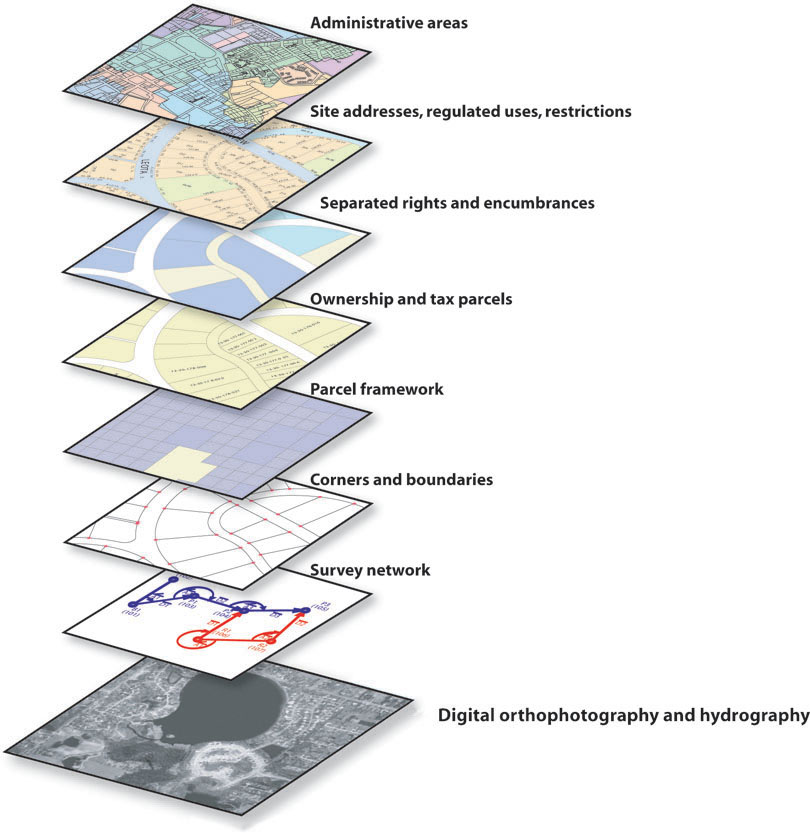
GIS can process numerous large spatial data layers together at once. Thinking about the vacation home example, there are many additional factors that play into choosing the site of a second home—access to recreational amenities, the price of the land, the availability of transportation networks, and how far the site is away from large urban areas, for instance. All of these factors (and more) come into play when you’re trying to find the optimal location for a vacation home. Similarly, if you work in the retail industry and are assessing which place is the best location for a new store, there are a lot of criteria that will influence your decision—how close the potential sites are to your existing store, how close that area is to similar stores, the population of the area, the average household income for each neighborhood, and the rental price of the property, to name just a few. GIS can handle all of these spatial factors by combining them together (see Figure 6.12 for an example of combining several data layers together).
GIS model a representation of the factors used for explaining the processes that underlie an event, or for predicting results
A GIS model is a representation that combines these spatial dimensions or characteristics together in an attempt to describe or explain a process, or to predict results. For instance, trying to predict where future urban developments will occur based on variables such as a location’s proximity to existing urban areas, the price of the land parcels, or the availability of transportation corridors, could be performed using GIS modeling, with the end result being a map of the places most likely to convert to an urban land use. There are many different types of GIS models with different features and complexities to them, and it’s far beyond the scope of this book to catalog and examine all of them.
173
GIS models are often used to examine various criteria together to determine where, spatially, some phenomenon is occurring or could potentially occur. These are often used in decision-making processes, or to answer questions (like the previous example of where to build a vacation home). Another example of this would be in determining which parcels of land surrounding Civil War battlefields are under the greatest pressure to convert to an urban land use. Battlefield land is often considered a historic monument to the men who died in the Civil War, and while the core areas of several sites are under the protection of the U. S. National Park Service, there are many other sites that have been developed or are in danger of having residential or commercial properties built on them, forever losing the “hallowed ground” of history.
GIS can be used to combine a number of factors together that influence where new developments are likely to occur (such as proximity to big cities, existing urban areas, or water bodies) in a fashion similar to site suitability in order to try and find the areas under the greatest development pressures. This type of information could be used by preservationists attempting to purchase lands with the intention of keeping them undeveloped.
MCE multi-criteria evaluation—the use of several factors (weighted and combined) to determine the suitability of a site for a particular purpose
The factors that contribute to a phenomenon can be constructed as layers within GIS, weighted (to emphasize which layers have a greater effect than others) and combined together. The end result will be a ranking of areas, to determine their suitability. One example of this process is referred to as multi-criteria evaluation (MCE), which takes layers that have been standardized and initially ranked against each other, then weights and combines them together. The MCE process produces a map showing various “pressures” at each location (along the lines of the Suitability Index map) to determine which places have the greatest influence placed on them (based on the combination of all the input layers). This acts like a more complex form of the basic site suitability, and can be used in decision-making processes—like determining which areas of battlefield land have the greatest developmental pressures on them to convert to an urban land use. Other problems, such as locating suitable animal habitats, areas of high flood potential, or places for retail sites can be approached using similar techniques.
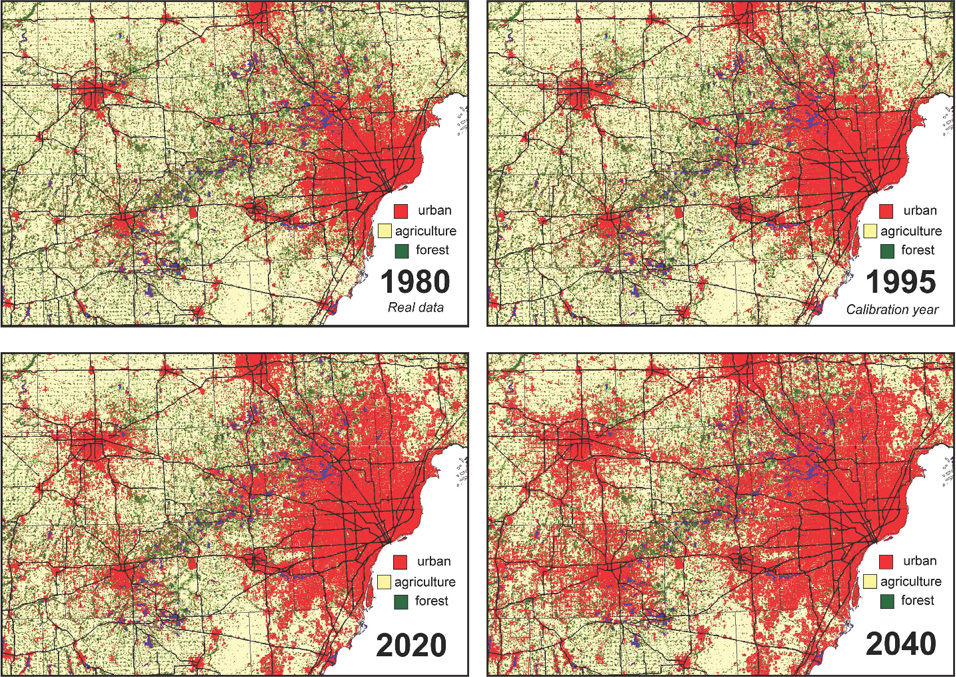
Another example of a GIS model is the Land Transformation Model (LTM), a tool used to combine various weighted raster layers together in order to determine where areas have changed over to an urban land use, and then to predict where areas are likely to change over to an urban land use in the future. See Figure 6.13 for an example of the output of the LTM’s predictive capability, covering areas in Michigan up to the year 2040. Also see Hands-on Application 6.3: The Land Transformation Model for further examination of the LTM as a GIS Model.
174
 HANDS-ON APPLICATION 6.3
The Land Transformation Model
The Land Transformation Model is headquartered at Purdue University. Open your Web browser and go to http://ltm.agriculture.purdue.edu/default_ltm.htm to visit the Website for LTM. Check it out for further background as an example of a GIS Model. The actual model itself (and sample datasets) can be downloaded, if you’re feeling adventurous, as well as a selection of graphics and papers related to the model.
Expansion Questions:

Question
What types of applications has the Land Transformation Model been used for?
-
Question
What kinds of GIS layers are used in this model for forecasting urban development?
175
 THINKING CRITICALLY WITH
GEOSPATIAL TECHNOLOGY 6.1
What Are Potential Societal or Policy Impacts of GIS Models?
The output of GIS Models is often used to aid in decision-making processes, and could have a significant impact in areas of concern to all of us. For instance, trying to determine which sites would make the most suitable locations for a new casino development would greatly affect the social, economic, and land use conditions of an area. If the end result of a model is to determine what areas of a residential area are under the greatest potential threat of flooding, it could have a strong impact on an area’s real estate market. What kinds of impacts can these types of models have on local, state, or federal policy?
There is also this question to consider: What if the model’s predictions are incorrect? If a model predicts that one area will be the optimal location for a new shopping center, and it turns out not to be, how could this kind of error affect this area and future decision making? Keep in mind that you could have a great model or design, but have inaccurate data for one (or more) of the layers. If that’s the case, how can having this kind of poor-quality data in a model affect the output (and what kinds of impacts could the results of models using inaccurate data have on policy decisions)?