8.1 
How Do You Model a Network for Geospatial Technology?
network a series of junctions and edges connected together for modeling concepts such as streets
junction a term used for the nodes (or places where edges come together) in a network
edge a term used for the links of a network
Back in Chapter 5, we discussed how real-world items are modeled, or represented, using GIS. Any type of network is going to involve connections between locations, whether those locations are streams, power lines, or roads. Thus (to use Esri terminology), in GIS a network in its most basic form is represented by a series of junctions (point locations or nodes) that are connected to each other by a series of edges (lines or links). For instance, in a road network, junctions might be the starting and ending points of a road, or they might be points of intersection with other roads, while the edge is the line that represents the road itself. When you’re designing a road network, keep in mind that there may be many types of edges and junctions to represent. For example, a city’s road network will have edges that represent streets, highways, railroads, light-rail systems, subway lines, or footpaths, while junctions may represent not only the beginnings and endings of streets, but also highway entrances and exits, freeway overpasses and underpasses, subway stops, or rail terminals.
connectivity the linkages between edges and junctions of a network
When you’re dealing with all these different types of edges and junctions, the connectivity of the network in GIS is essential when you come to model it. With proper connectivity, all junctions and edges should properly connect to one another, while things that should not connect, do not connect. For example, if a freeway crosses over a road via an overpass, the network connectivity should not show that as a valid junction where the street is allowed access to the freeway. If your vehicle navigation system leads you to this point, then instructs you to do the impossible and “turn right onto the highway,” it’s because the network data is set up to make it think you can. In the same way, a railroad line may intersect with a street, but the network should not have a connection showing that the street has direct practical access to the railroad line as they cross. If this kind of connection is built into the data, you could conceivably be routed to turn onto the railroad line and continue on it toward your destination. It sounds silly to think of driving your car on the railroad tracks, but if the network data is incorrect, this line might simply represent the next road to take to get to your destination.
Thinking along these lines, other features of a road network must also be included in the model. For instance, some streets may be one way, some junctions may not allow left-hand turns, or U-turns may not be permitted. These types of features need to be properly modeled for the system to be an accurate, realistic model of the road network. You can see the “one way” street sign when you’re driving, but if that feature hasn’t been properly set up in the network, the system has no way of knowing it shouldn’t route cars in both directions along the street. As we discussed previously, an overpass or underpass should not show up as being connected to the road network (as a viable option for a turn—if a device or GIS instructs you to make a right-hand turn onto the freeway that you’re currently driving under, then something’s gone wrong with some aspect of the technology).
247
line segment a single edge of a network that corresponds to one portion of a street (for instance, the edge between two junctions)
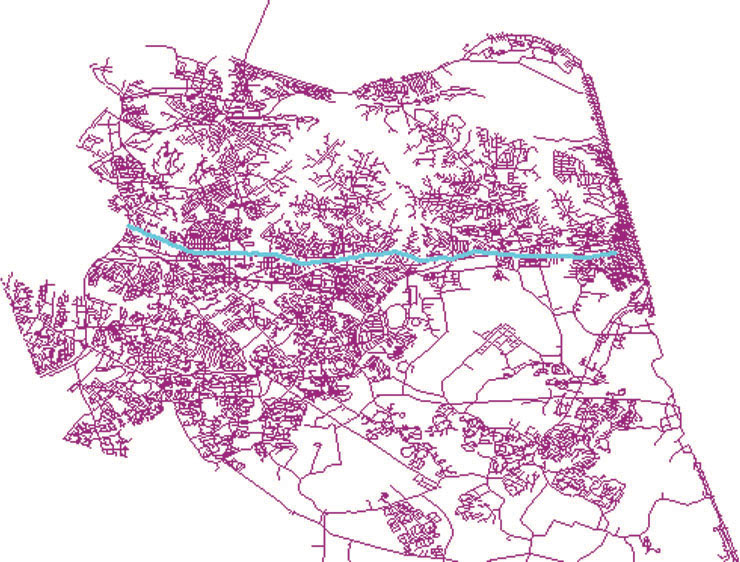
When you’re modeling a network, you should consider each edge as a separate entity, though not necessarily each individual street. A long city street may be modeled in the GIS as several line segments, with each segment representing a section of the street. A major urban street may be made up of more than 100 line segments—each segment being a different section of the street (with each segment being delineated by roads that intersect it). For example, Figure 8.2 shows a geospatial road network in Virginia Beach, Virginia. The road cutting through the center of the city (highlighted in blue) is Virginia Beach Boulevard, a major multi-lane city street, with numerous intersecting roads and street lights. Although we think of Virginia Beach Boulevard as one big, long street, the system models it as 129 line segments, with each line segment representing a portion of its length.
Breaking a road up into individual line segments allows the modeling of different attributes for each segment. Attributes such as the road’s name, the address ranges for each side of the road, the suffix of the road’s name (Drive, Avenue, Boulevard, etc.), the type of road it is (residential street, interstate, highway, etc.), and the speed limit are examples of values that can be assigned to individual segments. Thus, an attribute table of this layer in a GIS would consist of 129 records, each with multiple attributes.
street centerline a file containing line segments representing roads
TIGER/Line a file produced by the U.S. Census Bureau that contains (among other items) the line segments that correspond with roads all over the United States
Several different types of geospatial road network files are available. A street centerline file is a file that models each city road as a line, and contains lines for the different types of roads. The U.S. Census Bureau regularly issues this type of road network data in a format usable by geospatial technology software. The data is provided in the TIGER/Line files. TIGER stands for Topologically Integrated Geographic Encoding Referencing, and the files delineate different boundaries throughout the United States (such as congressional districts), in addition to containing road-network data. (See Hands-on Application 8.1: TIGER Files Online for more information.)
248
 HANDS-ON APPLICATION 8.1
TIGER Files Online
TIGER files are made freely available from the Census Bureau via the Web. Open your Web browser and go to http://www.census.gov/geo/www/tiger. This is the part of the U.S. Census Bureau’s Website for downloading TIGER/Line files. There’s also full documentation of TIGER files available in PDF format on the Website. Files for U.S. counties can be downloaded in shapefile format (see Chapter 5 for more info about shapefiles) to be used in GIS products like ArcGIS or QGIS. You can also download several other types of TIGER files besides road-network data, including census block information, hydrography, landmarks, and American Indian reference data—check to see what types of datasets are available for download.
Esri also makes TIGER 2000 data freely available—this data has already been separated into its various components (such as roads, railroads, etc.) for download, so that each layer can be downloaded as its own shapefile. Open your Web browser and go to http://arcdata.esri.com/data/tiger2000/tiger_download.cfm. All data is downloaded in a zipped shapefile format for use in programs like ArcGIS or QGIS. Select your county to see what TIGER data is available for you to use. This chapter’s lab uses a TIGER dataset downloaded from the Esri Website.
Expansion Questions:

Question
What kinds of transportation data are contained within TIGER/Line files besides just roads?
-
Question
What kinds of TIGER data are available for your county?
Each record in a TIGER/Line file represents a segment of a road network, and thus each segment (record) can have multiple attributes (fields) assigned to it. Figure 8.3 shows a TIGER/Line file of Virginia Beach and a portion of the attribute table of those selected segments that make up Virginia Beach Boulevard. Note how many attributes there are (information gets encoded into each road segment, and the entire Virginia Beach TIGER/Line file is made up of over 19,000 segments). Previous TIGER/Line files contain the following standard attributes (among others):

- FEDIRP: This is the prefix direction of the road (N. Smith St. or W. Broad Ave.).
- FENAME: This is the name of the road (N. Smith St. or W. Broad Ave.).
- FETYPE: This is the type of road (N. Smith St. or W. Broad Ave.).
- FEDIRS: This is the suffix direction of the road (Cherry Lane S. or Canal Street E.).
- CFCC: This is the Census Feature Class Code, a standardized encoding used to separate different kinds of roads (such as residential streets, highways, or interstates).
- FRADDL: This is the start of the address range on the left side of the road (for instance, if the addresses go from 101 to 199, this value would be 101).
- TOADDL: This is the end of the address range on the left side of the road (for instance, if the addresses go from 101 to 199, this value would be 199).
- FRADDR: This is the start of the address range on the right side of the road (for instance, if the addresses go from 100 to 198, this value would be 100).
- TOADDR: This is the end of the address range on the right side of the road (for instance, if the addresses go from 100 to 198, this value would be 198).
- ZIPL: This is the zip code used for addresses on the left side of the road.
- ZIPR: This is the zip code used for addresses on the right side of the road.
More recent TIGER/Line files have different attributes that have similar functions, depending on the type of TIGER/Line file that is used. For instance, the attributes in the Address Range-Feature County-based files are:
- FULLNAME: This is the name of the road
- LFROMHN: This is the start of the address range on the left side of the road
- LTOHN: This is the end of the address range on the left side of the road
- RFROMHN: This is the start of the address range on the right side of the road
- RTOHN: This is the end of the address range on the right side of the road
- ZIPL: This is the zip code for addresses on the left side of the road
- ZIPR: This is the zip code for addresses on the right side of the road
- EDGE_MTFCC: This is the primary feature class code as defined by the MAF/TIGER database used by the U.S. Census (used to distinguish different types of roads).
These kinds of attributes define the characteristics of each road segment, and similar attributes would be found in road-network data, such as other street centerline files. If these attributes are incorrect, then the base network map will be incorrect. If the vehicle navigation system gives you incorrect street names or calls a road “east” when it’s really “west,” it’s likely that there are incorrect values in the base network data’s attributes.
Attributes like those from the TIGER/Line files or similar street-network data created by others concerning specific address ranges, zip-code information, and detailed data for the names of roads can be used as a base map source for other applications, such as pinpointing specific addresses on a road. It’s this source data that allows for a match of a typed street address to a map of the actual location.